Navigating Loop Intelligence
Last updated: April 7, 2026
The Home Page
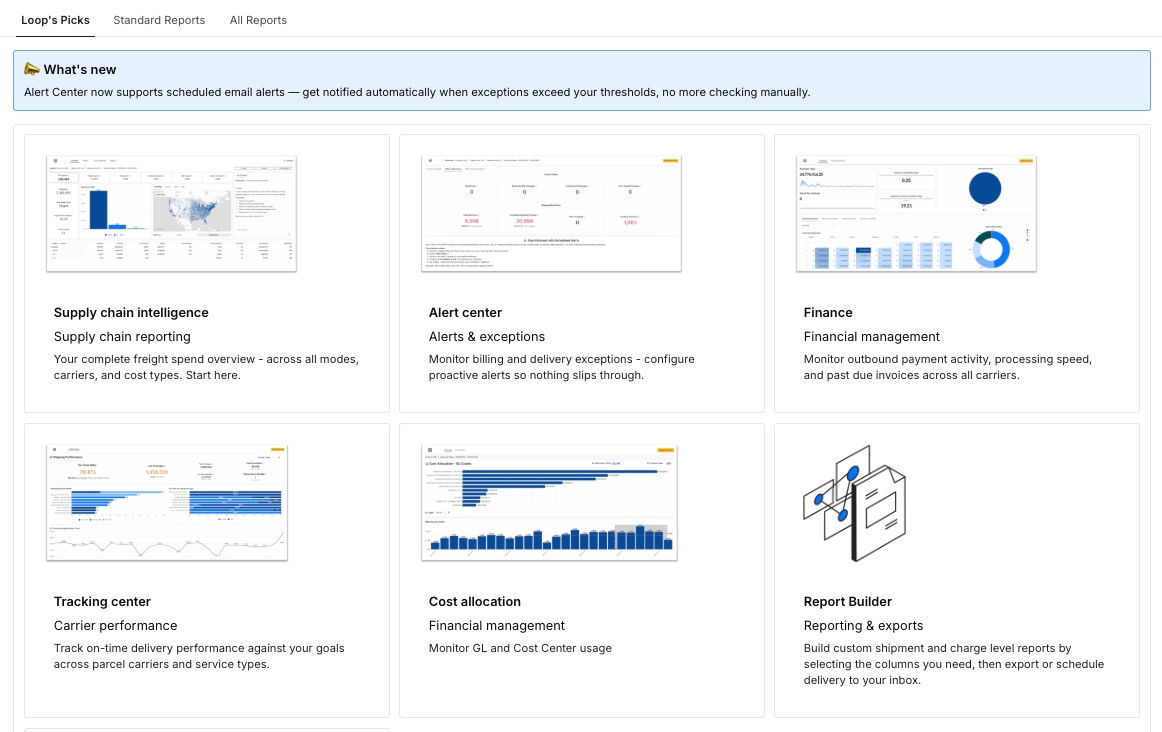
When you open Intelligence, you land on the homepage. From here, you can open any report by clicking on it, or use the top navigation tabs to browse:
Tab | What's here |
Loop Picks | The default view — curated reports recommended for your account |
Standard Reports | Reports tied to the specific modes and services you have with Loop. What you see reflects your relationship with Loop. |
All Reports | Everything — standard reports, any custom reports your team has built, and shared views |
Key Navigation Tips
To update filters for the entire report, go to Report Controls or Settings in the top right corner. Any changes you make there apply to the whole report — dates, carriers, modes, and more all update at once.
To return to the Intelligence home page from anywhere, click the four-square icon (⊞) in the top right corner.
Report Modes
Mode | Who uses it | What it allows |
View | All users | Browse data, apply filters, interact with charts |
Explore | Explore-access users | Customize layouts, add columns, save custom views |
Most users spend all of their time in View or Explore mode. If you'd like upgraded access, reach out to your Customer Success Manager.
Drilling into Data
One of Intelligence's most useful features is the ability to drill from a high-level summary down to individual shipment records.

Select Drill Through in the top right corner to see the entire data set powering your workbook, OR
Hover over any KPI tile or chart to see quick filter options
Double-click any table or chart to open the underlying row-level data
Use "Columns Shown" in the top right of the exploration view to add or remove fields
Close the exploration panel via the three-dot menu (⋮) to return to the main dashboard
Filters and Report Controls
Two Types of Filters
Intelligence has two types of filters — one that affects the whole report, and one that only affects a single element.
Report Controls — Global Filters
Report Controls are the master filters for an entire report. When you change something here, every page and every element in the report updates together.
How to access:
Click "Report Controls" in the top right corner of the report
Set your filters — dates, carriers, modes, and more
Click "Close View" when done
What you can filter by:
Category | What's included |
Carriers & clients | Specific carriers or business units |
Dates & units | Date range, miles, pounds, currency |
Services & lanes | Service types, origin/destination lanes |
Advanced | GL codes, cost centers |
The default date range is the last 6 months, filtered by shipment date.
Tile-Level Filters — Local Filters
You can also filter individual KPI tiles without affecting the rest of the report.
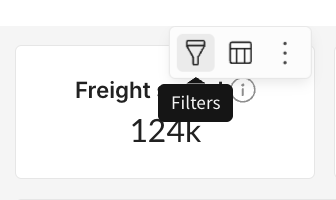
Hover over any tile to reveal filter options
Changes here only affect that one tile
The rest of the dashboard stays unchanged
Filter Behavior at a Glance
Where you filter | What updates |
Report Controls (top right) | The entire report — all pages, all elements |
Tile-level filter (hover) | That one tile only |
Legend click in a chart | That chart displays only |
Resetting Filters
To reset all filters and return to the default view, go back to the published version of the report. This removes all changes, including column adjustments and custom layouts.
Filtering Tips
Search for multiple values at once using commas in any filter bar
Switching between pages does not reset your Report Controls — your filters stay active as you move between tabs