Real-time Visibility Dashboard
Last updated: October 6, 2026
What It Is
The Real-time Visibility dashboard shows where your parcel packages are in the carrier network and how they're performing against the delivery dates you promised customers. Use it to track on-time performance, find packages that haven't been picked up by the carrier, and act on packages likely to arrive late.
If Real-Time Visibility is not currently part of your Loop services and you’re interested in learning more or adding it to your account, please reach out to your Customer Success Manager.
1. Getting started
When you open the Real-time Visibility dashboard, you land on the Performance page. The tabs along the top take you to the other pages: Performance, Dwell, Speed Stats, Parcel Status Overview, At Risk Exceptions, Pipeline and Network Monitoring.
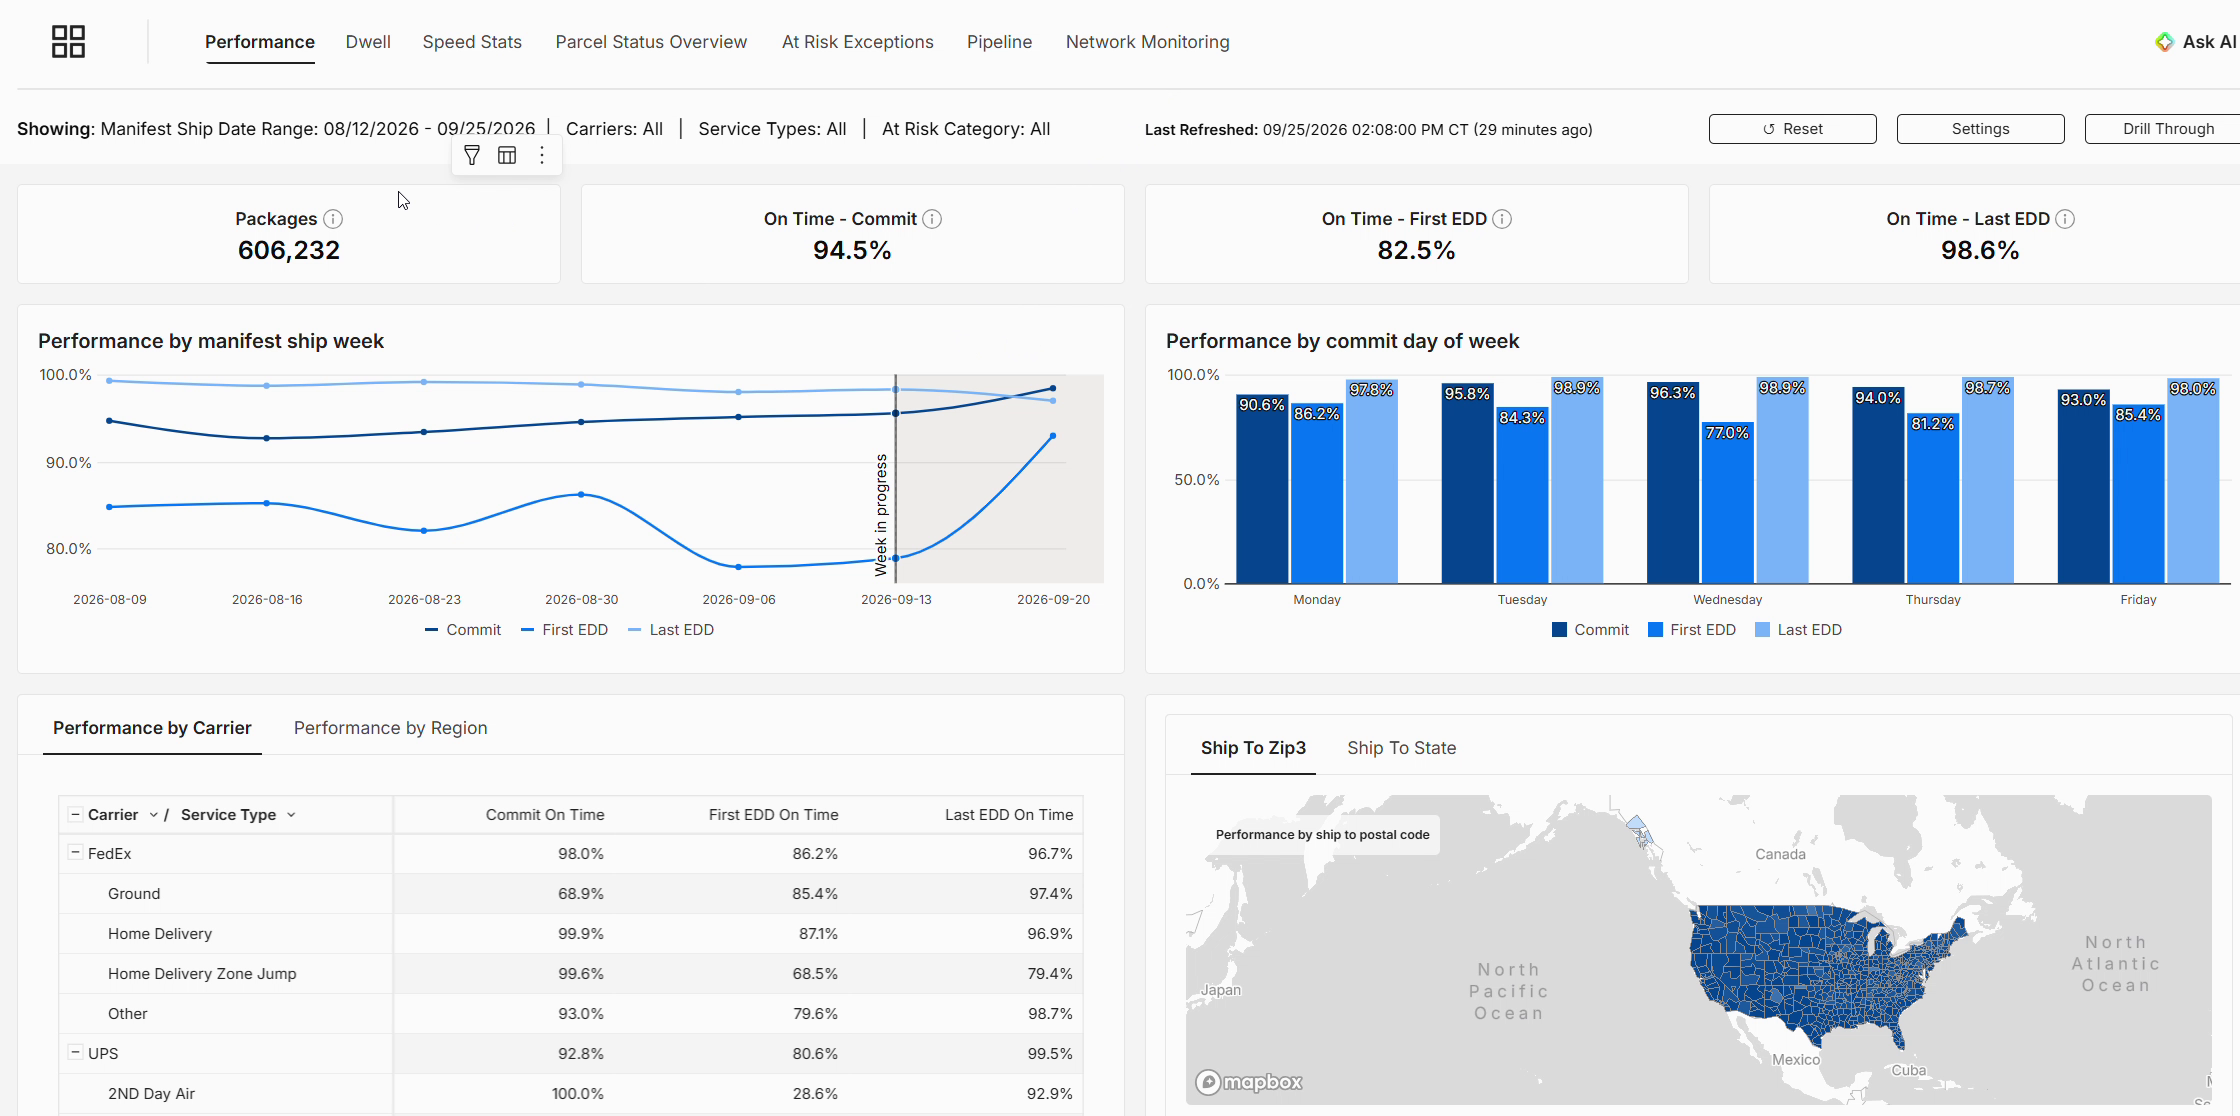
Figure 1. The Performance page, where the dashboard opens, with page tabs along the top.
The header bar
Every page shares the same header bar:
Showing: a summary of the filters currently applied (manifest ship date range, carriers, service types, at-risk category).
Last Refreshed: when the data was last updated.
Reset: clears any filters you've applied.
Settings: opens Report Controls, where you set filters for the whole dashboard (see Section 11).
Drill Through: opens package-level detail you can filter and export (see Section 10).
Default data window
By default the dashboard includes the last 45 days of data, based on manifest ship date. That keeps the focus on your most recent packages: ones likely to still be in the network or recently delivered.
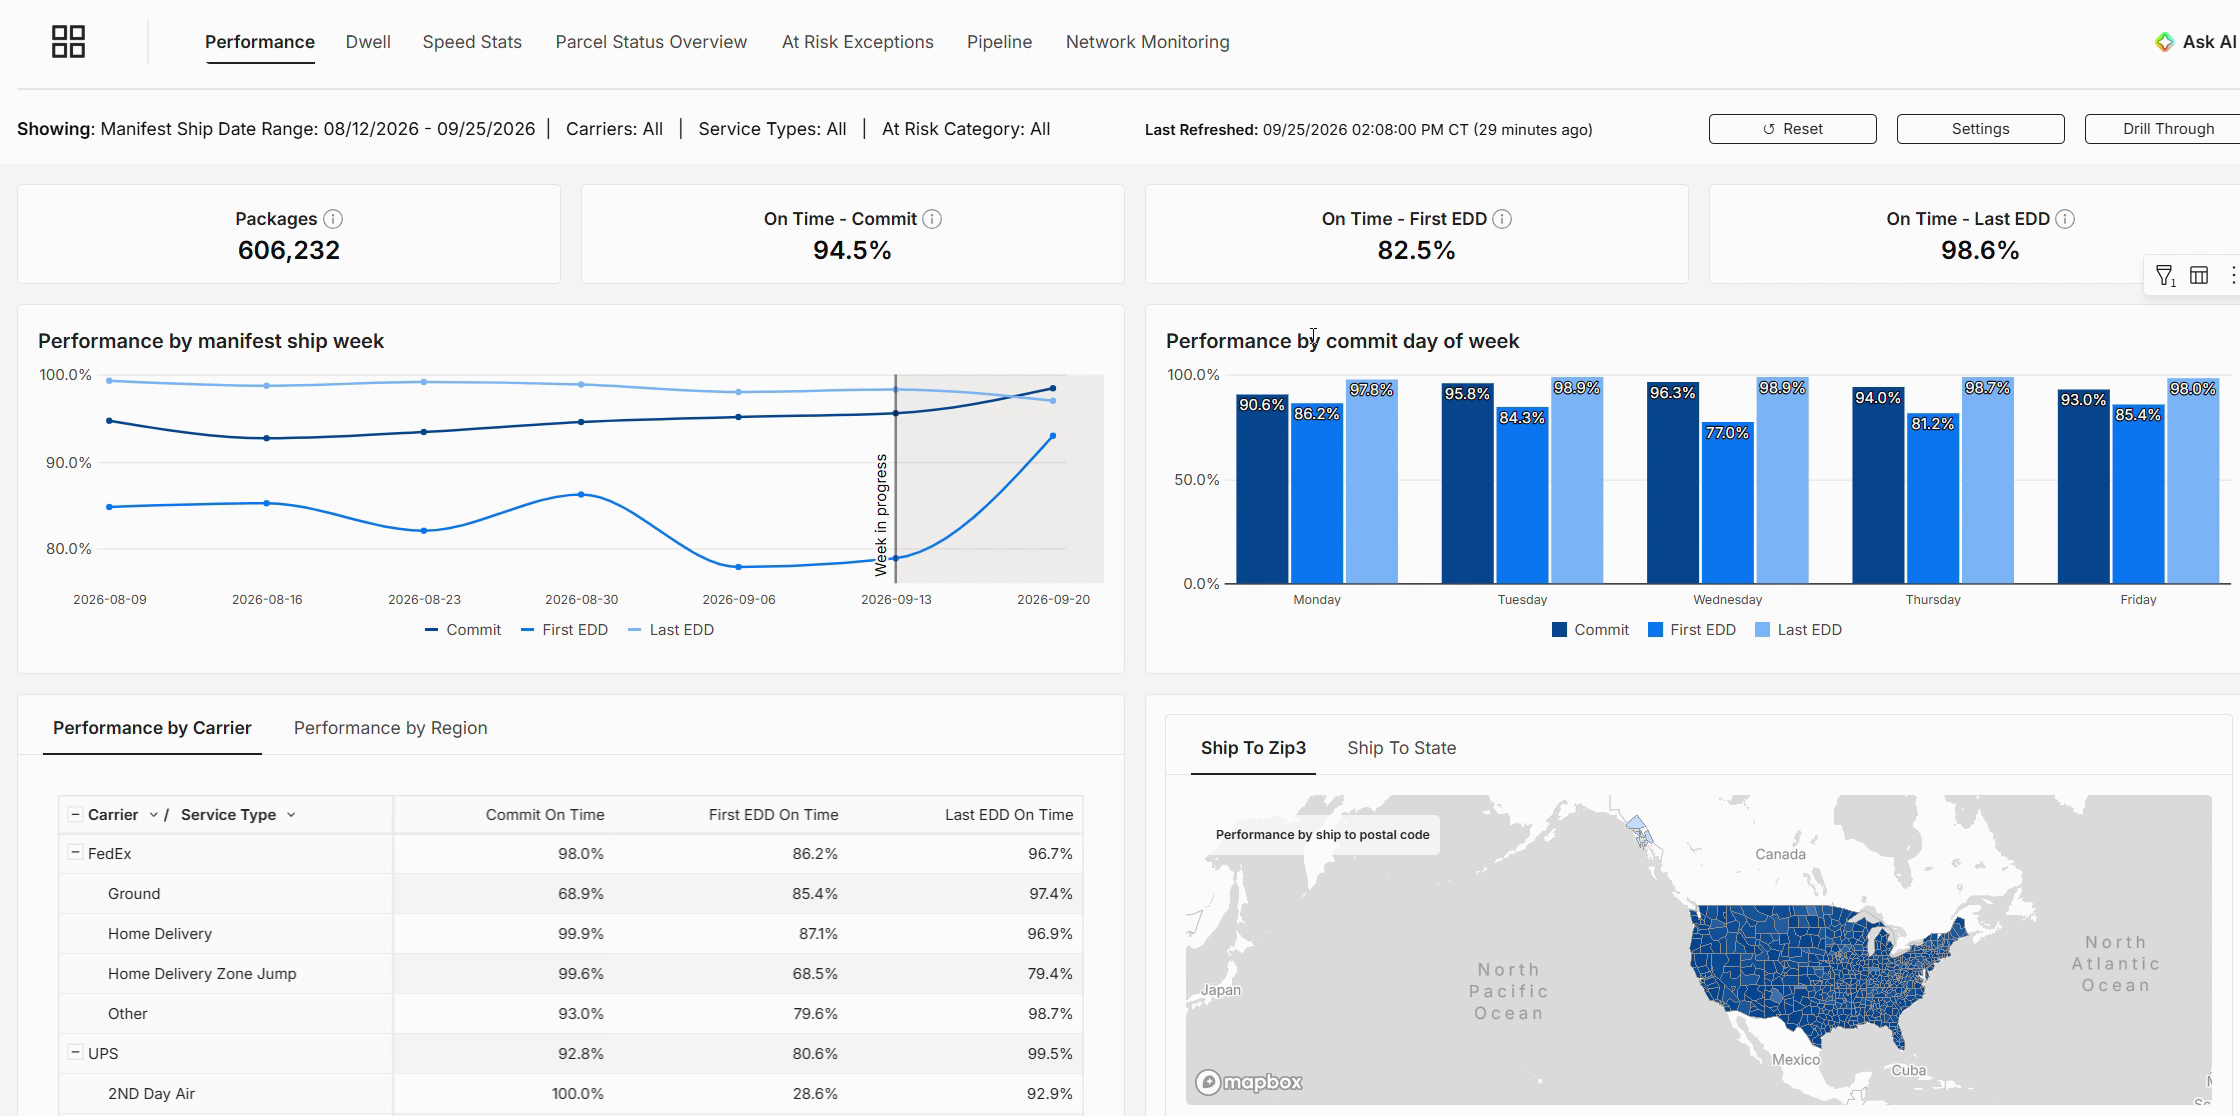
Figure 2. The header bar shows the default 45-day manifest ship date range.
2. Key terms
Term | What it means |
Commit date | The date you promised the package to your end customer. Commit performance measures how often packages arrive by that date. |
First EDD | The first Expected Delivery Date the carrier sends for a package. |
Last EDD | The carrier updates the EDD over the package's life. The Last EDD is the final date they send. |
Physical scan | Any carrier scan showing the carrier has actually taken possession of the package. A virtual scan (the carrier saying it expects to receive the package) does not count. |
Dwell | The period between the manifest ship date and the first physical carrier scan. |
Calendar / Business days | Transit metrics can be measured in calendar days or business days using the toggle on the page. |
3. Performance
The Performance page shows different slices of on-time performance against three measures: Commit, First EDD and Last EDD. The tiles at the top give the overall figures for the current data window.
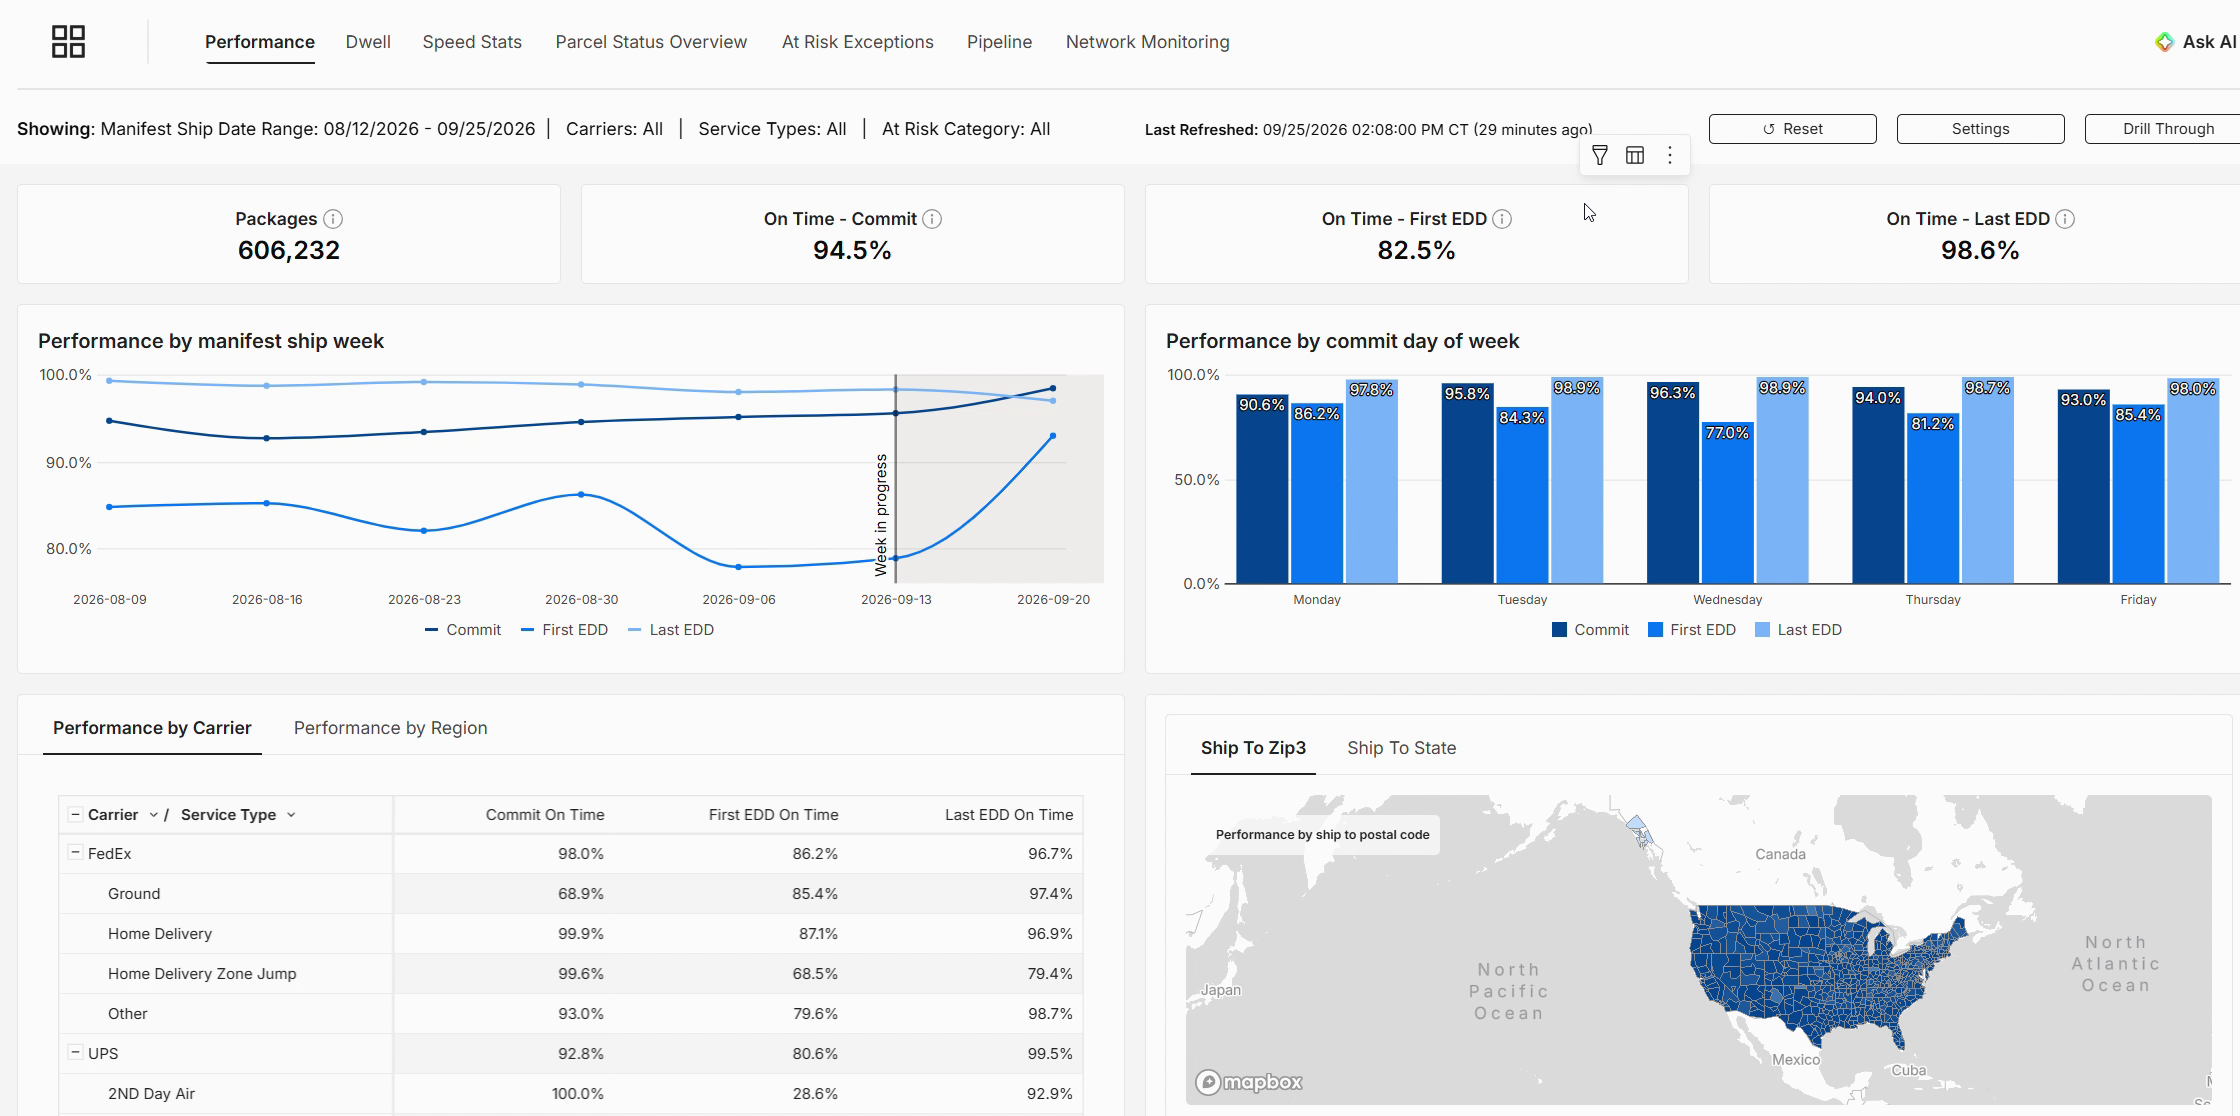
Figure 3. Headline tiles: total packages, Commit, First EDD and Last EDD on-time performance.
By manifest ship week and commit day of week
The trend chart shows performance by manifest ship week. The bar chart shows it by commit day of week. For example, the Monday bars show Commit, First EDD and Last EDD performance for packages with a Monday commit date.
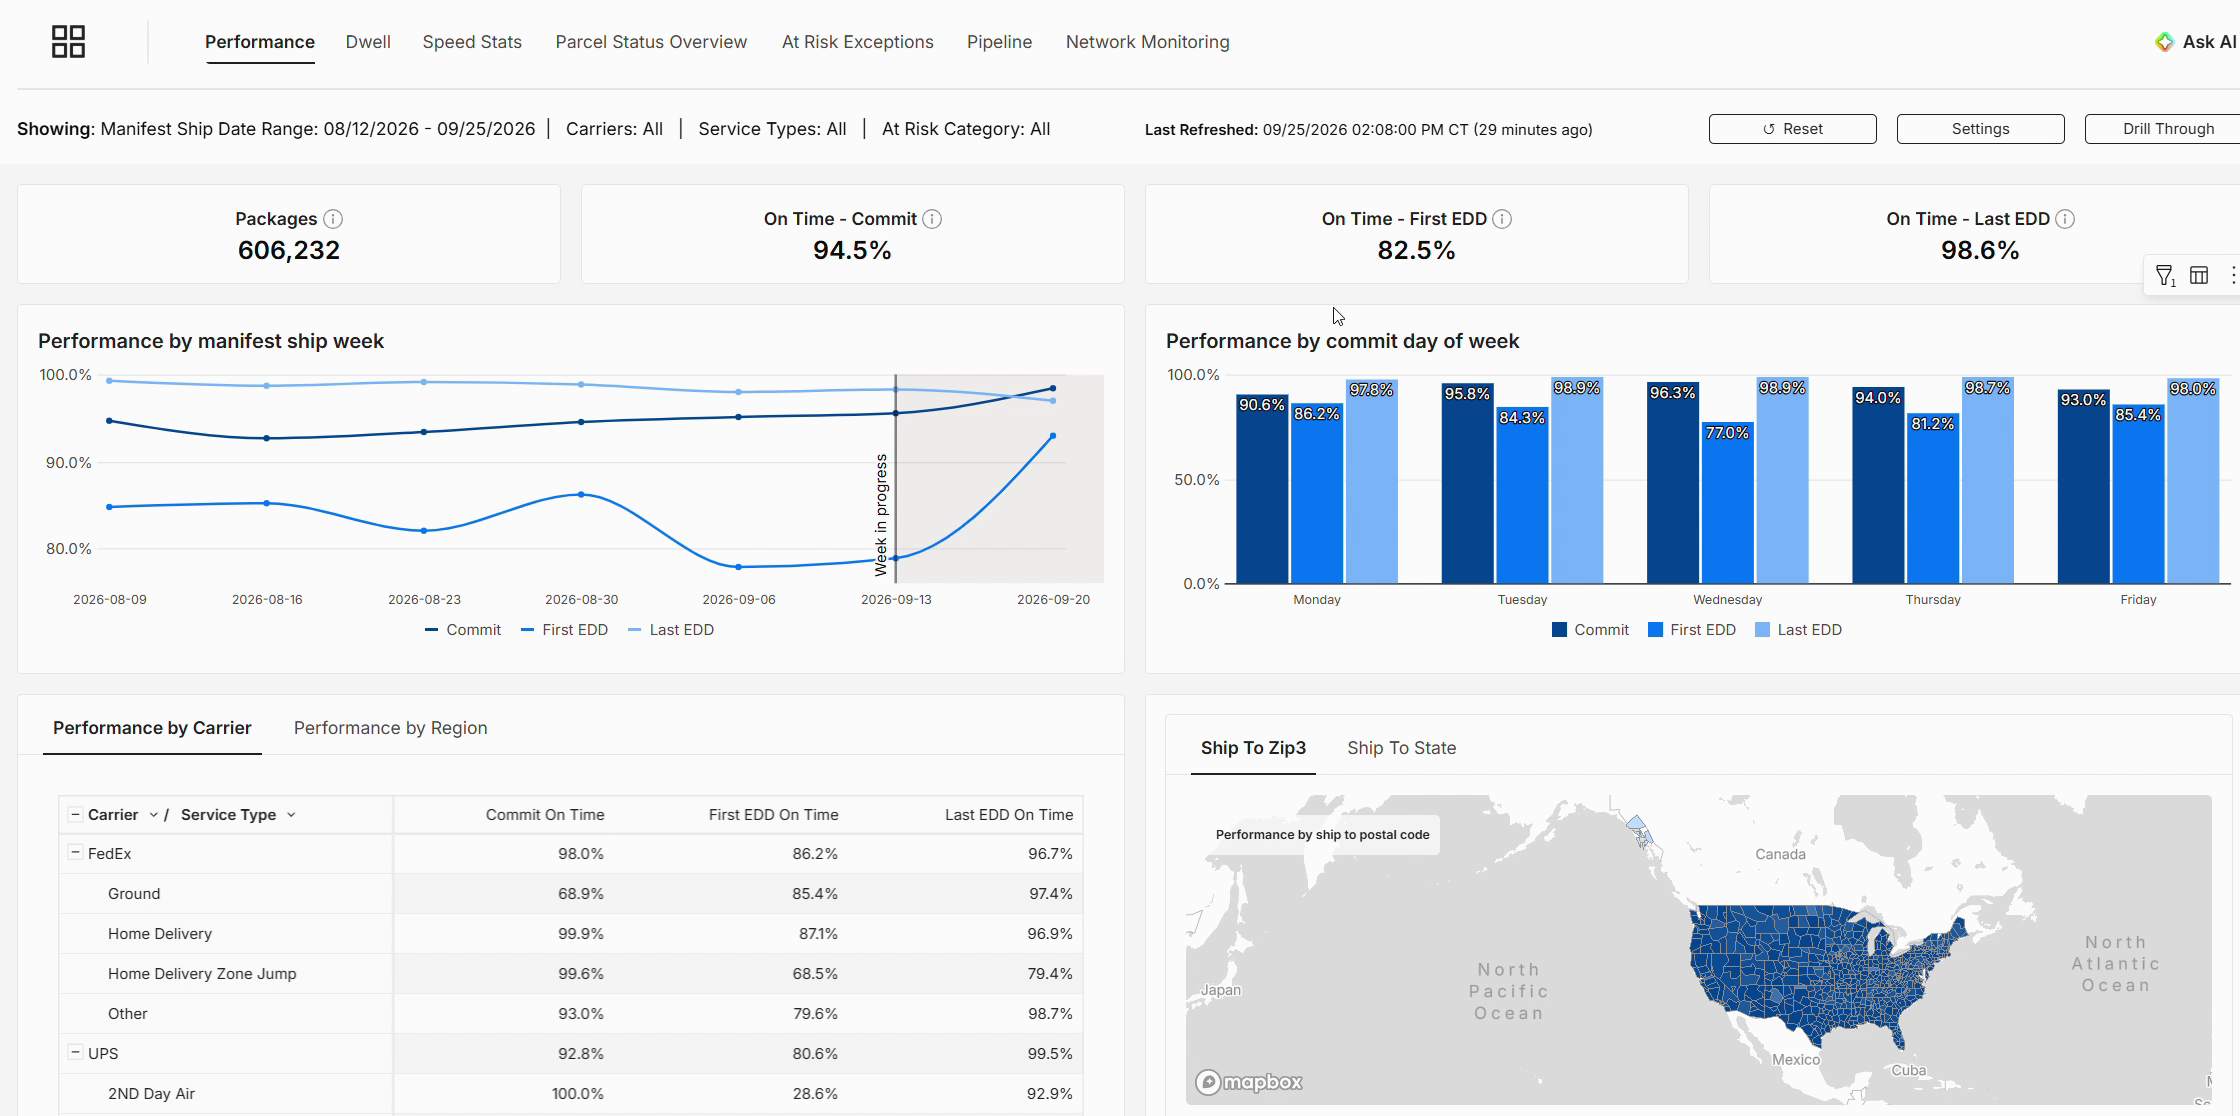
Figure 4. Performance by manifest ship week (left) and by commit day of week (right).
By carrier, region and geography
Lower on the page you'll see performance by carrier (and service type) and by region, plus a map by three-digit postal code. Hover over an area of the map to see its three metrics.
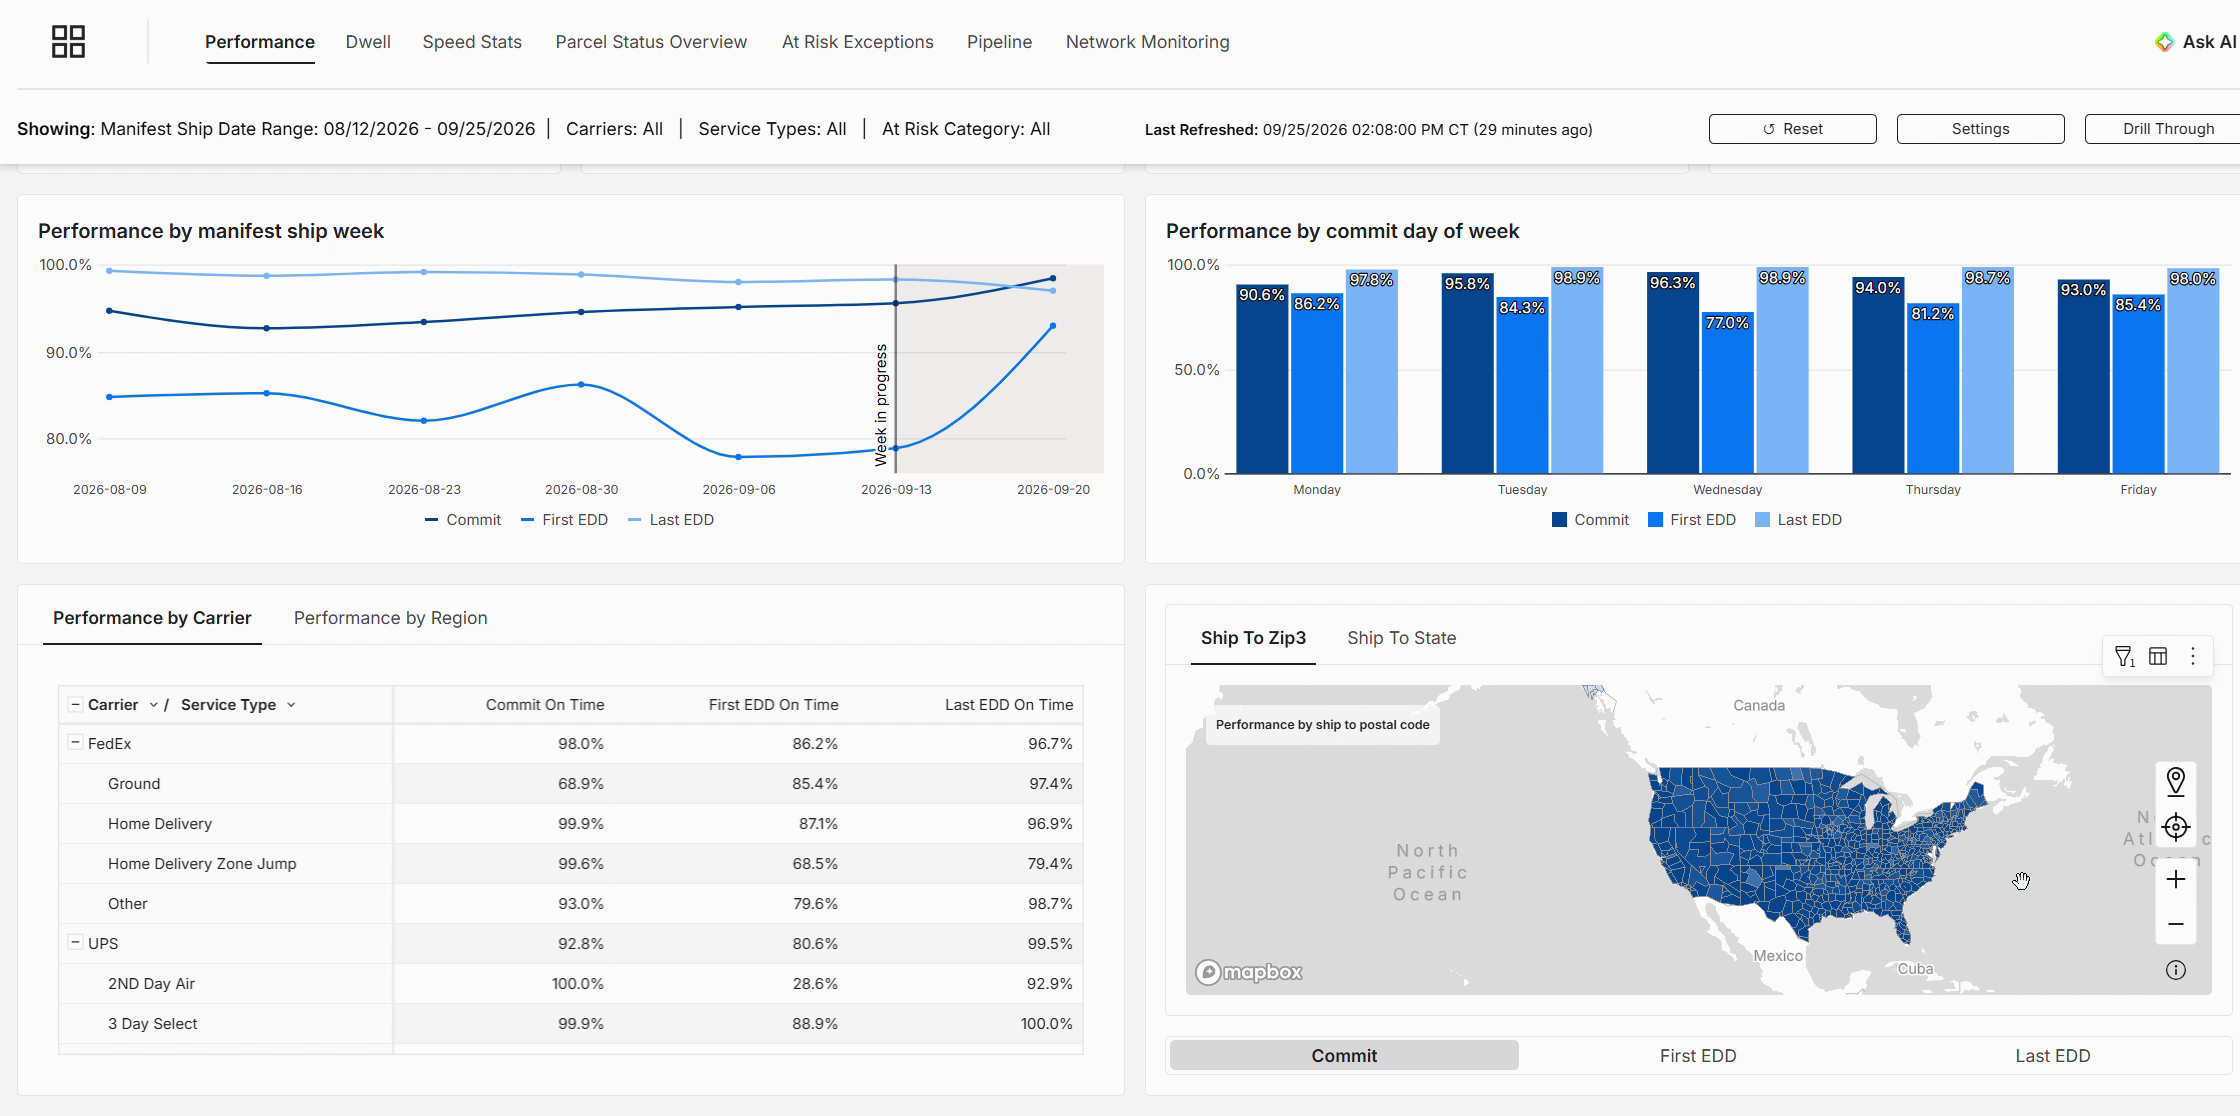
Figure 5. Performance by carrier and the 3-digit postal code map.
Switch the map to the Ship To State tab to see the same metrics by state.
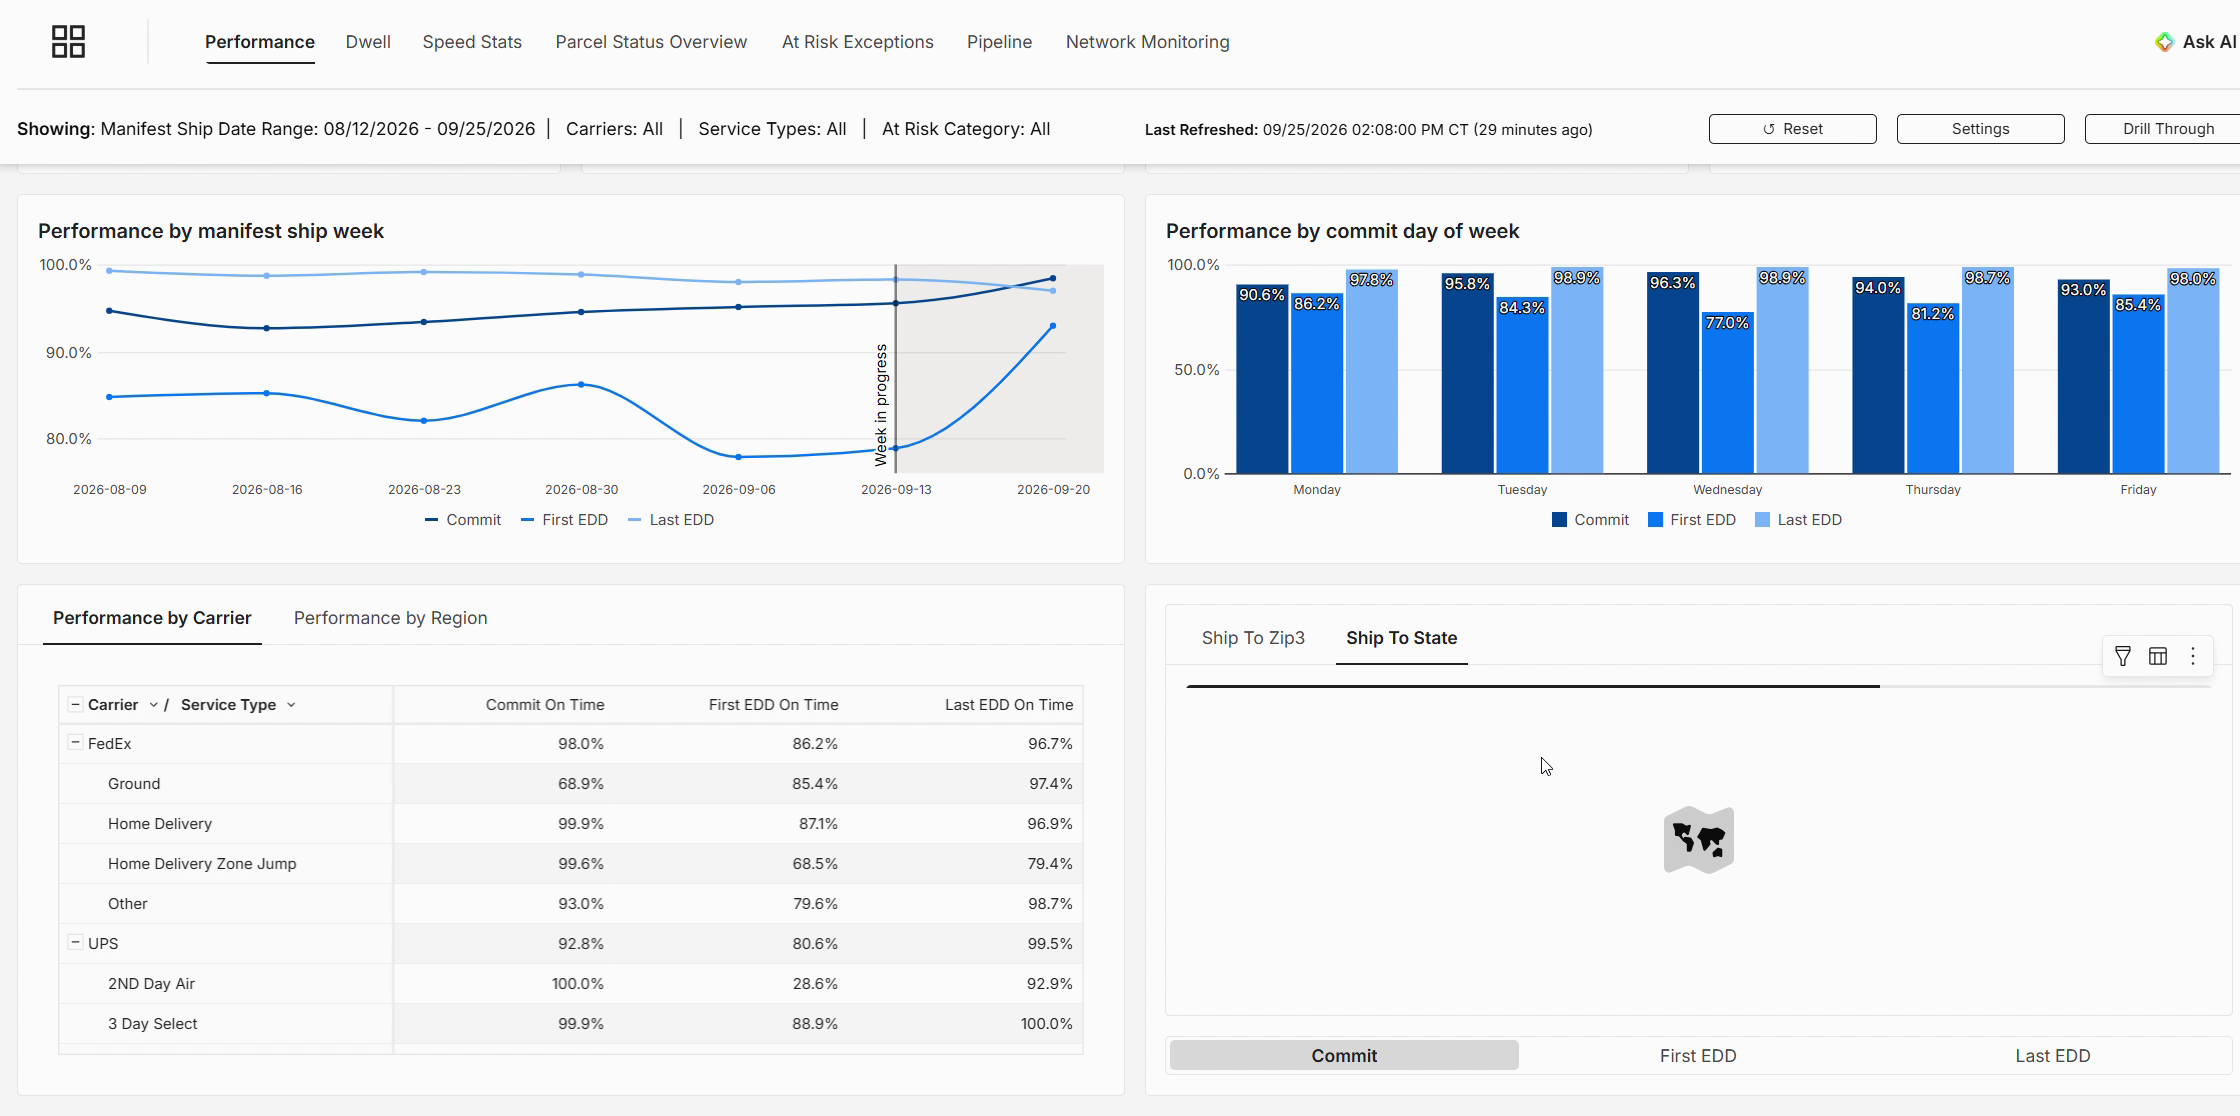
Figure 6. The map's Ship To State view.
4. Dwell
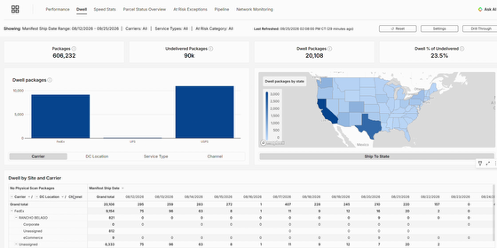
The Dwell report shows packages that are dwelling: they have a manifest ship date but the carrier hasn't physically scanned them yet. Once a physical scan comes in, the package is moving through the network and drops out of dwell.
Remember: only a physical scan ends dwell. A virtual scan, where the carrier says it expects to receive the package, doesn't count. |
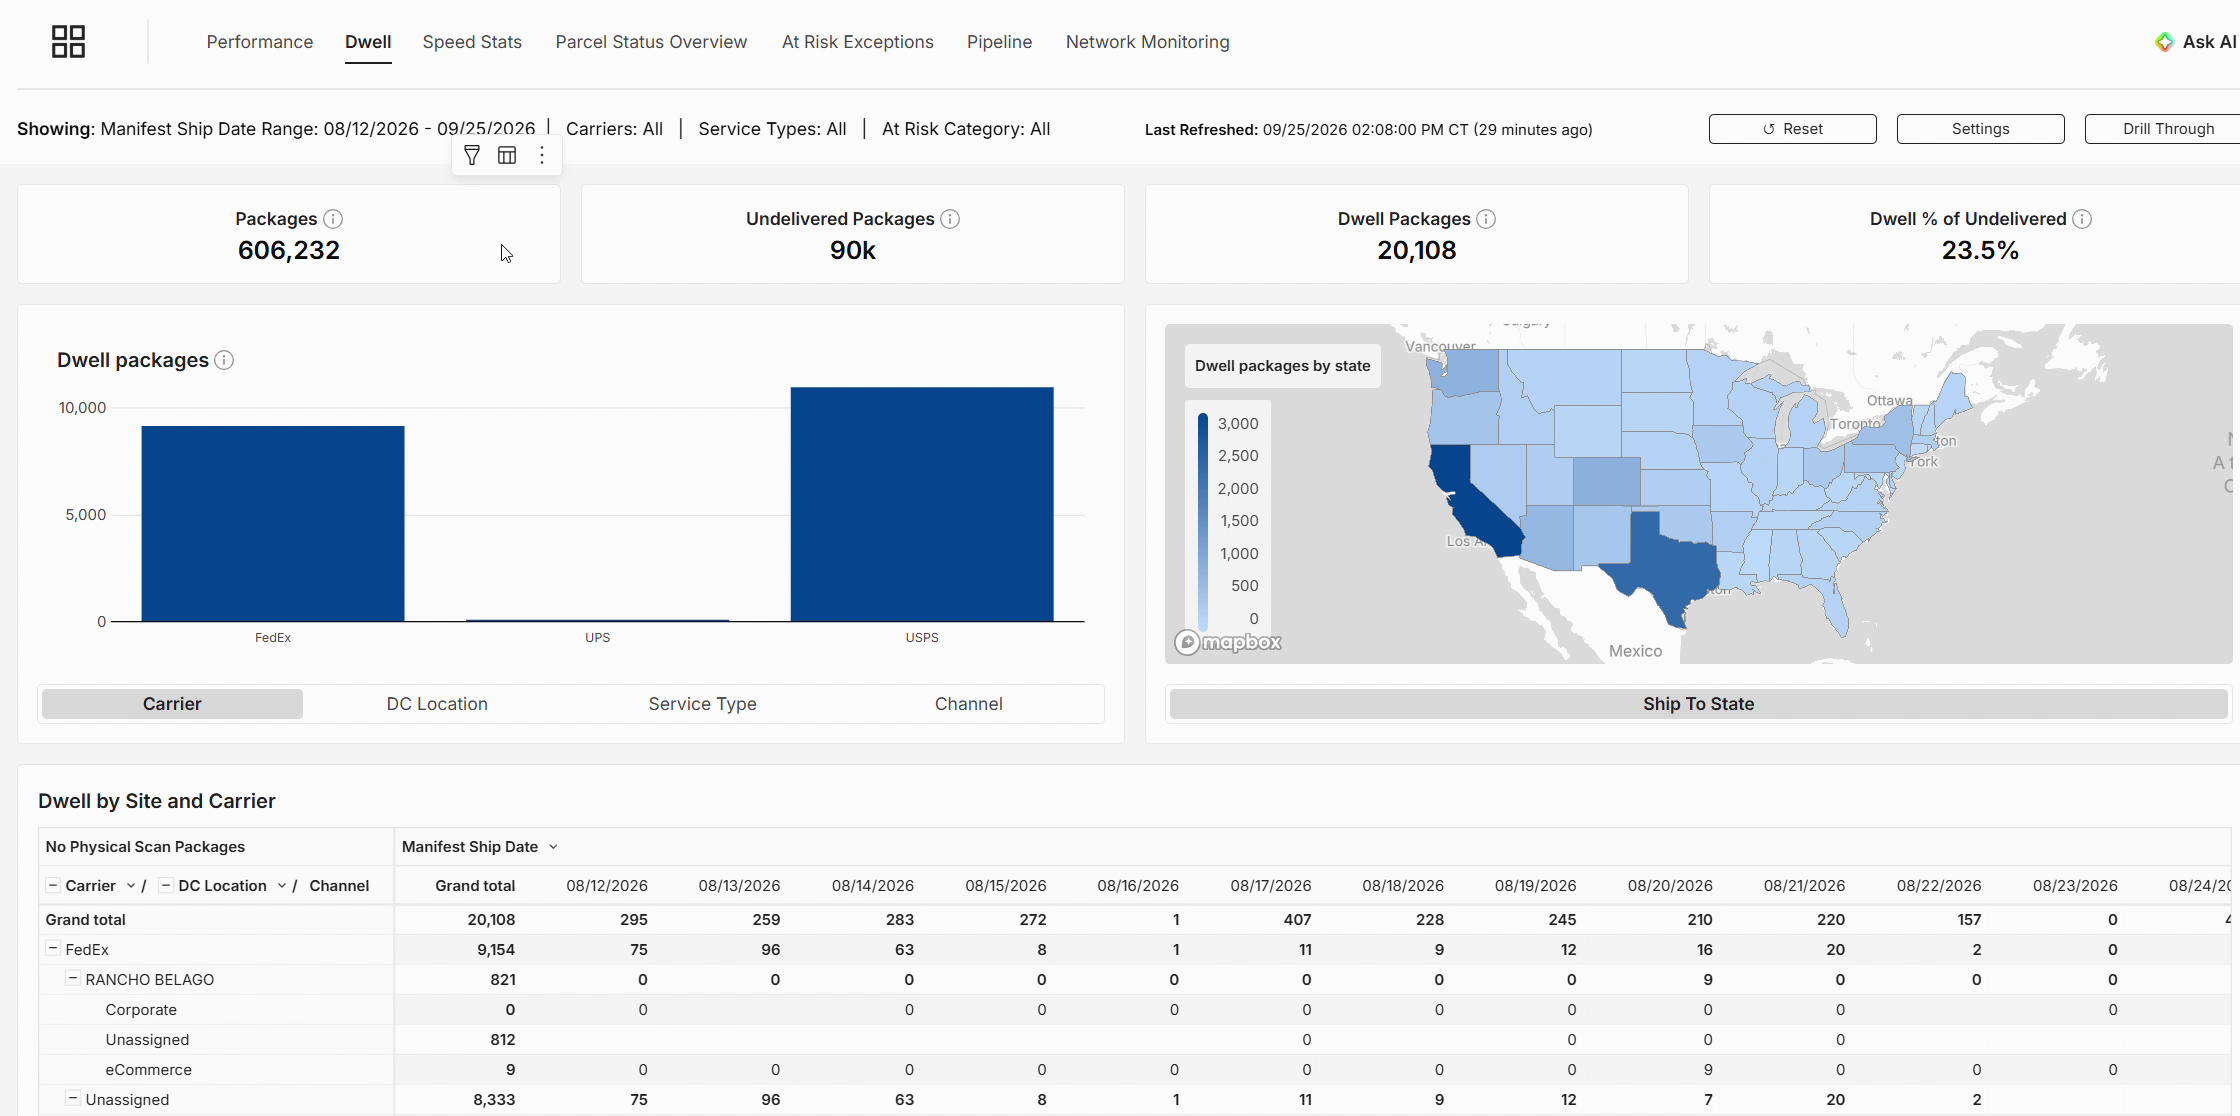
Figure 7. The Dwell report: dwell packages, undelivered packages and dwell % of undelivered.
Use the tabs to break dwell out by Carrier, DC Location, Service Type or Channel. Use the map and the Dwell by Site and Carrier table to see where packages are stuck between manifest and the first physical scan.
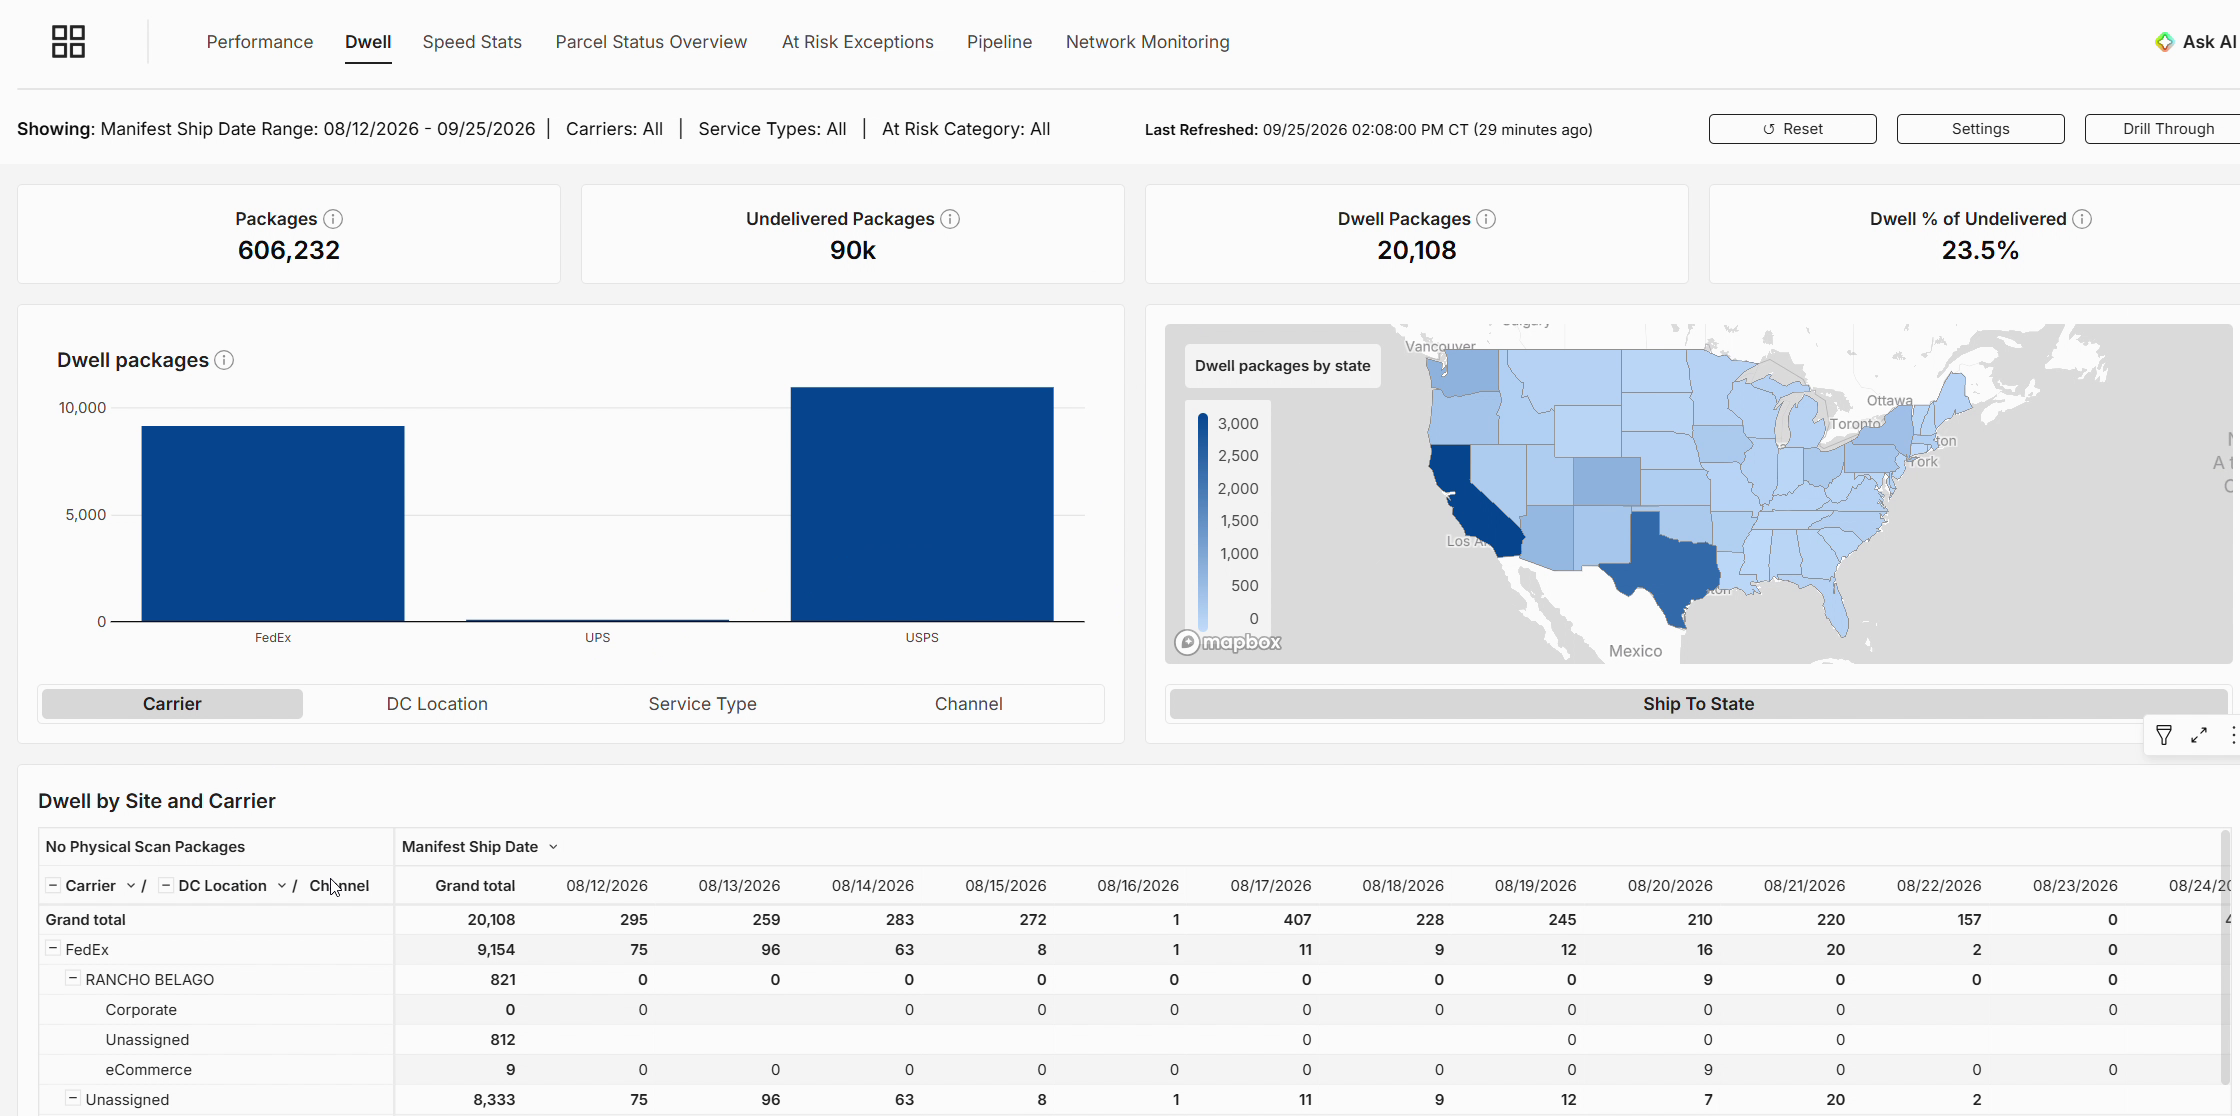
Figure 8. Dwell broken out by carrier, by ship-to state and by site and ship date.
5. Speed Stats
Speed Stats tracks transit from order all the way to delivery:
· Order to Ship: days from order to manifest ship.
· Ship to Delivery: days from ship to delivery.
· Order to Delivery: the overall end-to-end picture.
The table breaks these out by carrier. Use the tabs to switch to DC Location or Channel. The Order to delivery days running total chart shows the cumulative share of packages delivered by each day count.
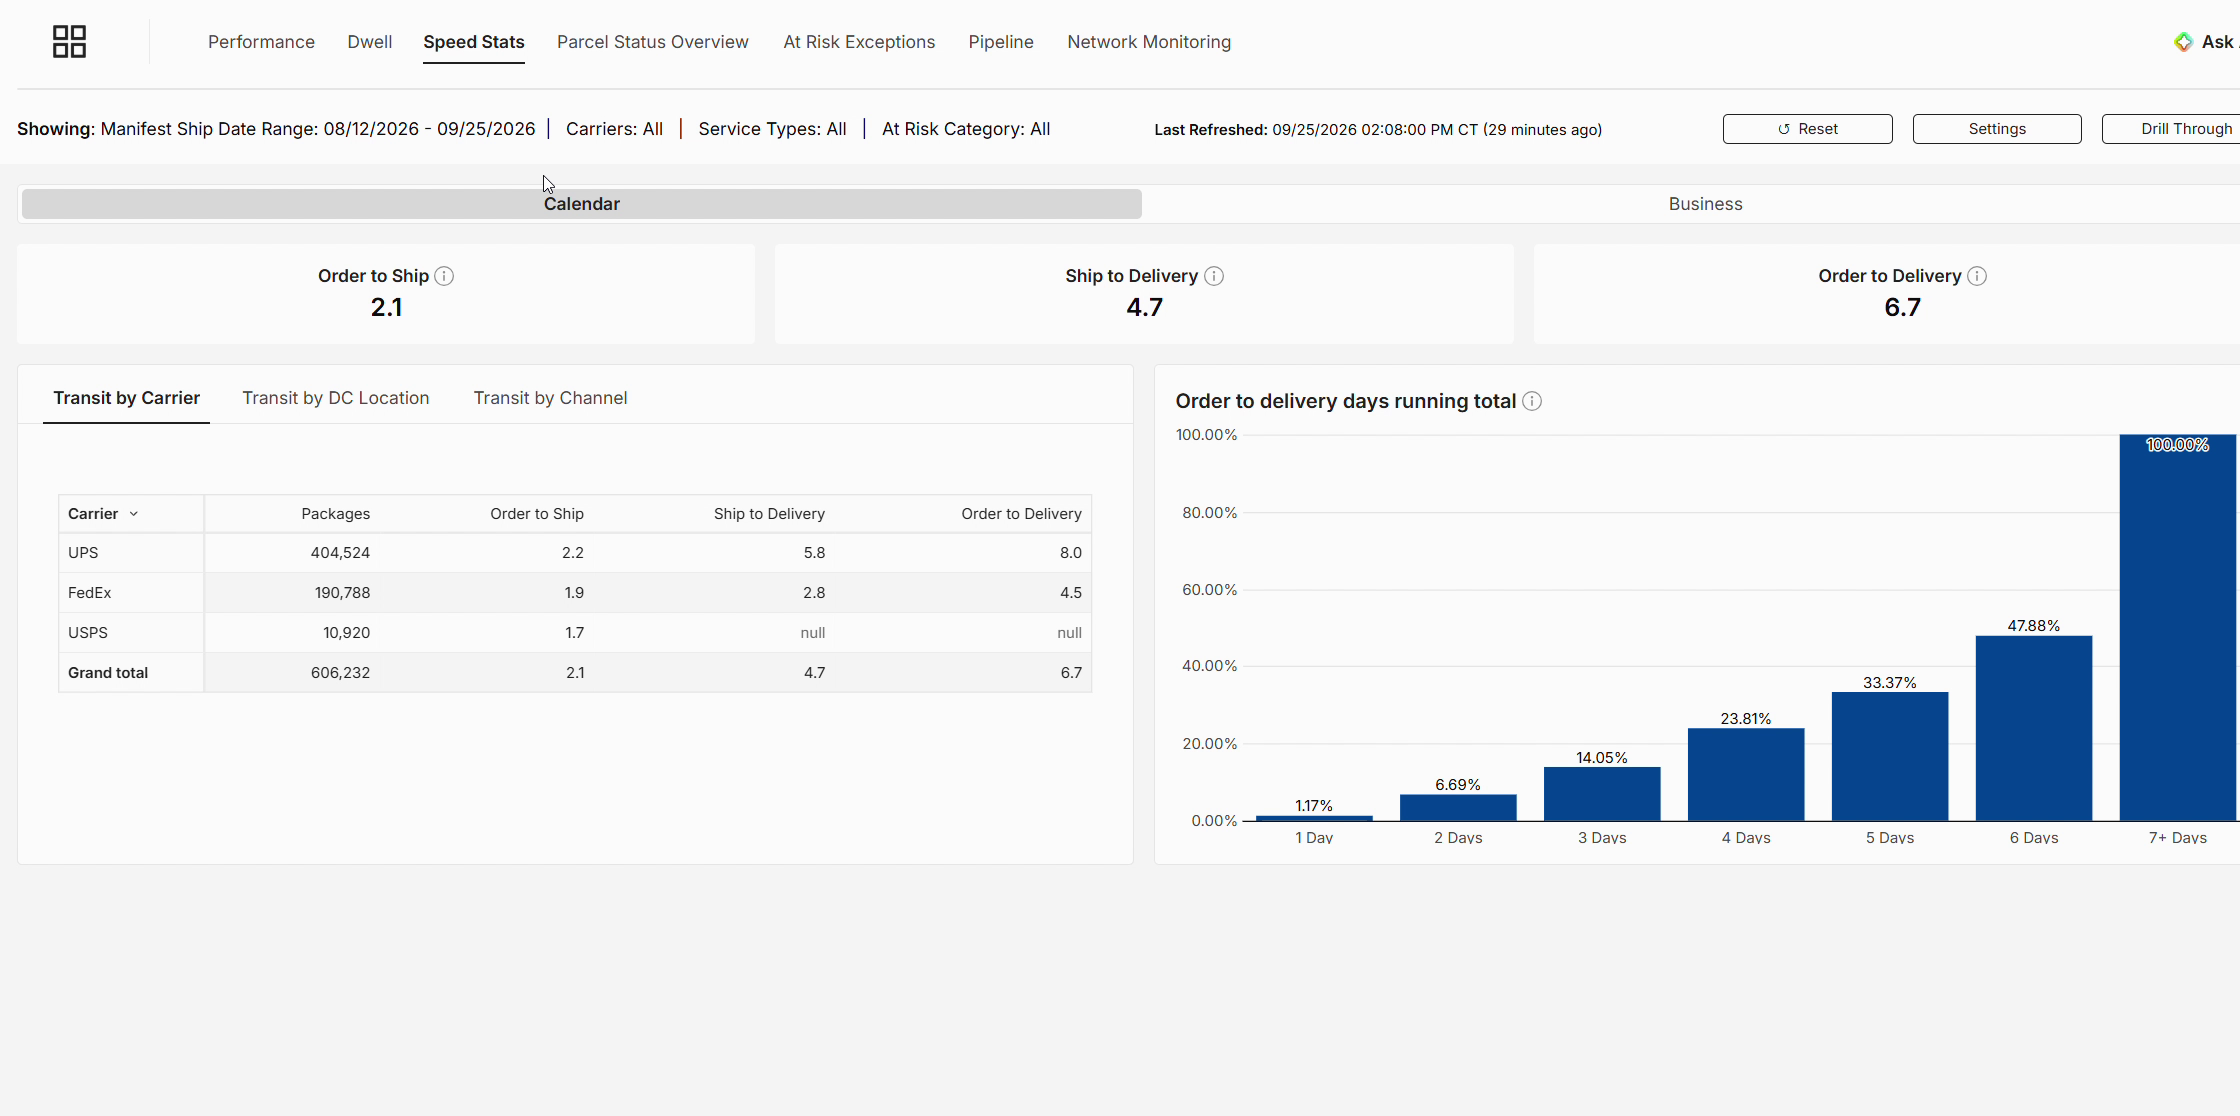
Figure 9. Speed Stats in calendar days, with transit by carrier.
To measure in business days instead of calendar days, click the Business toggle at the top of the page.
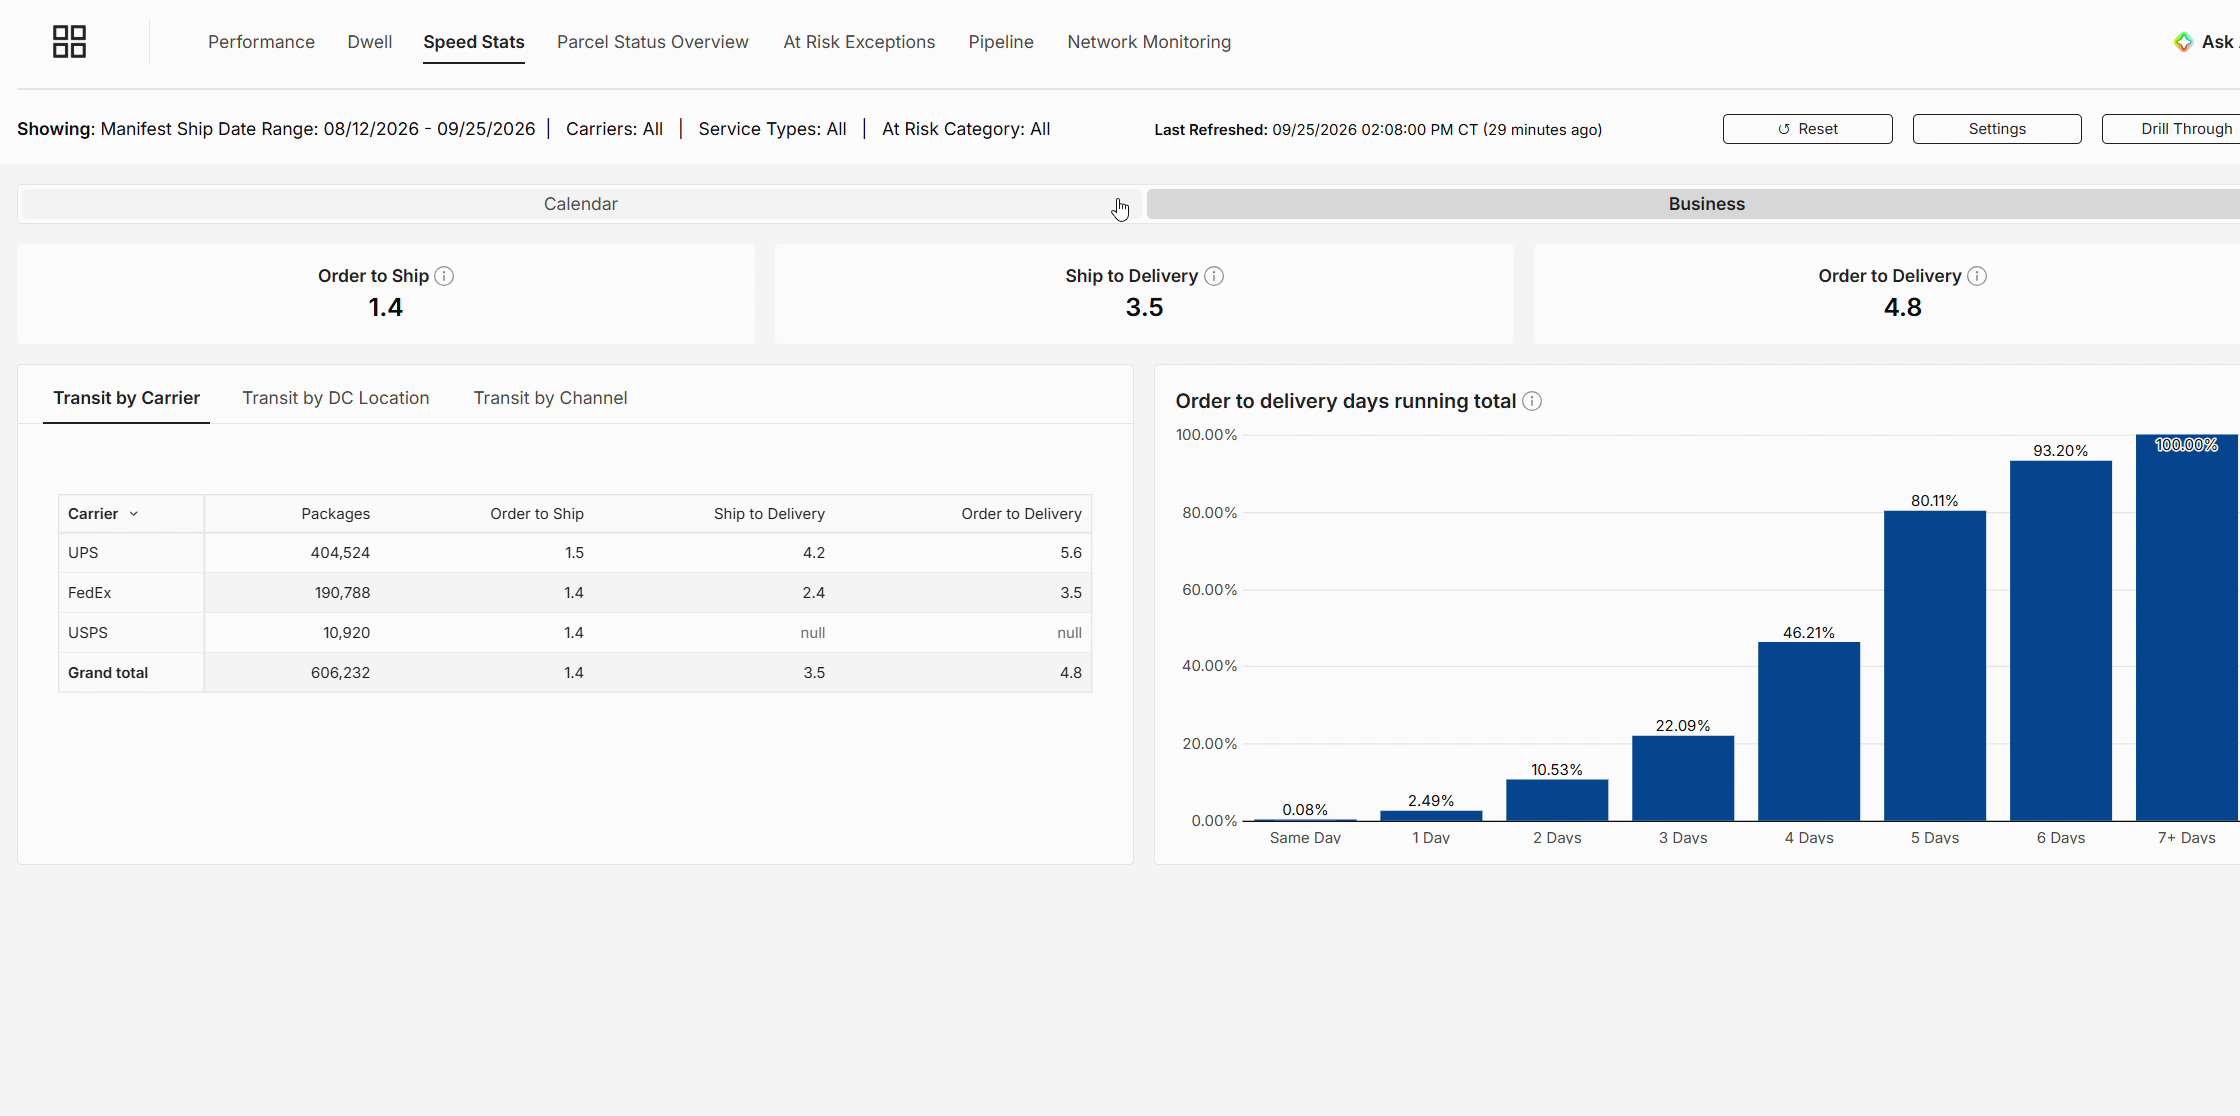
Figure 10. The same view with the Business days toggle selected.
6. Parcel Status Overview
This page puts each package in the network into a status category, so you can see where it is: from initial in transit through to delivered, including delivery to pickup locations, no physical scan, return to shipper and exceptions.
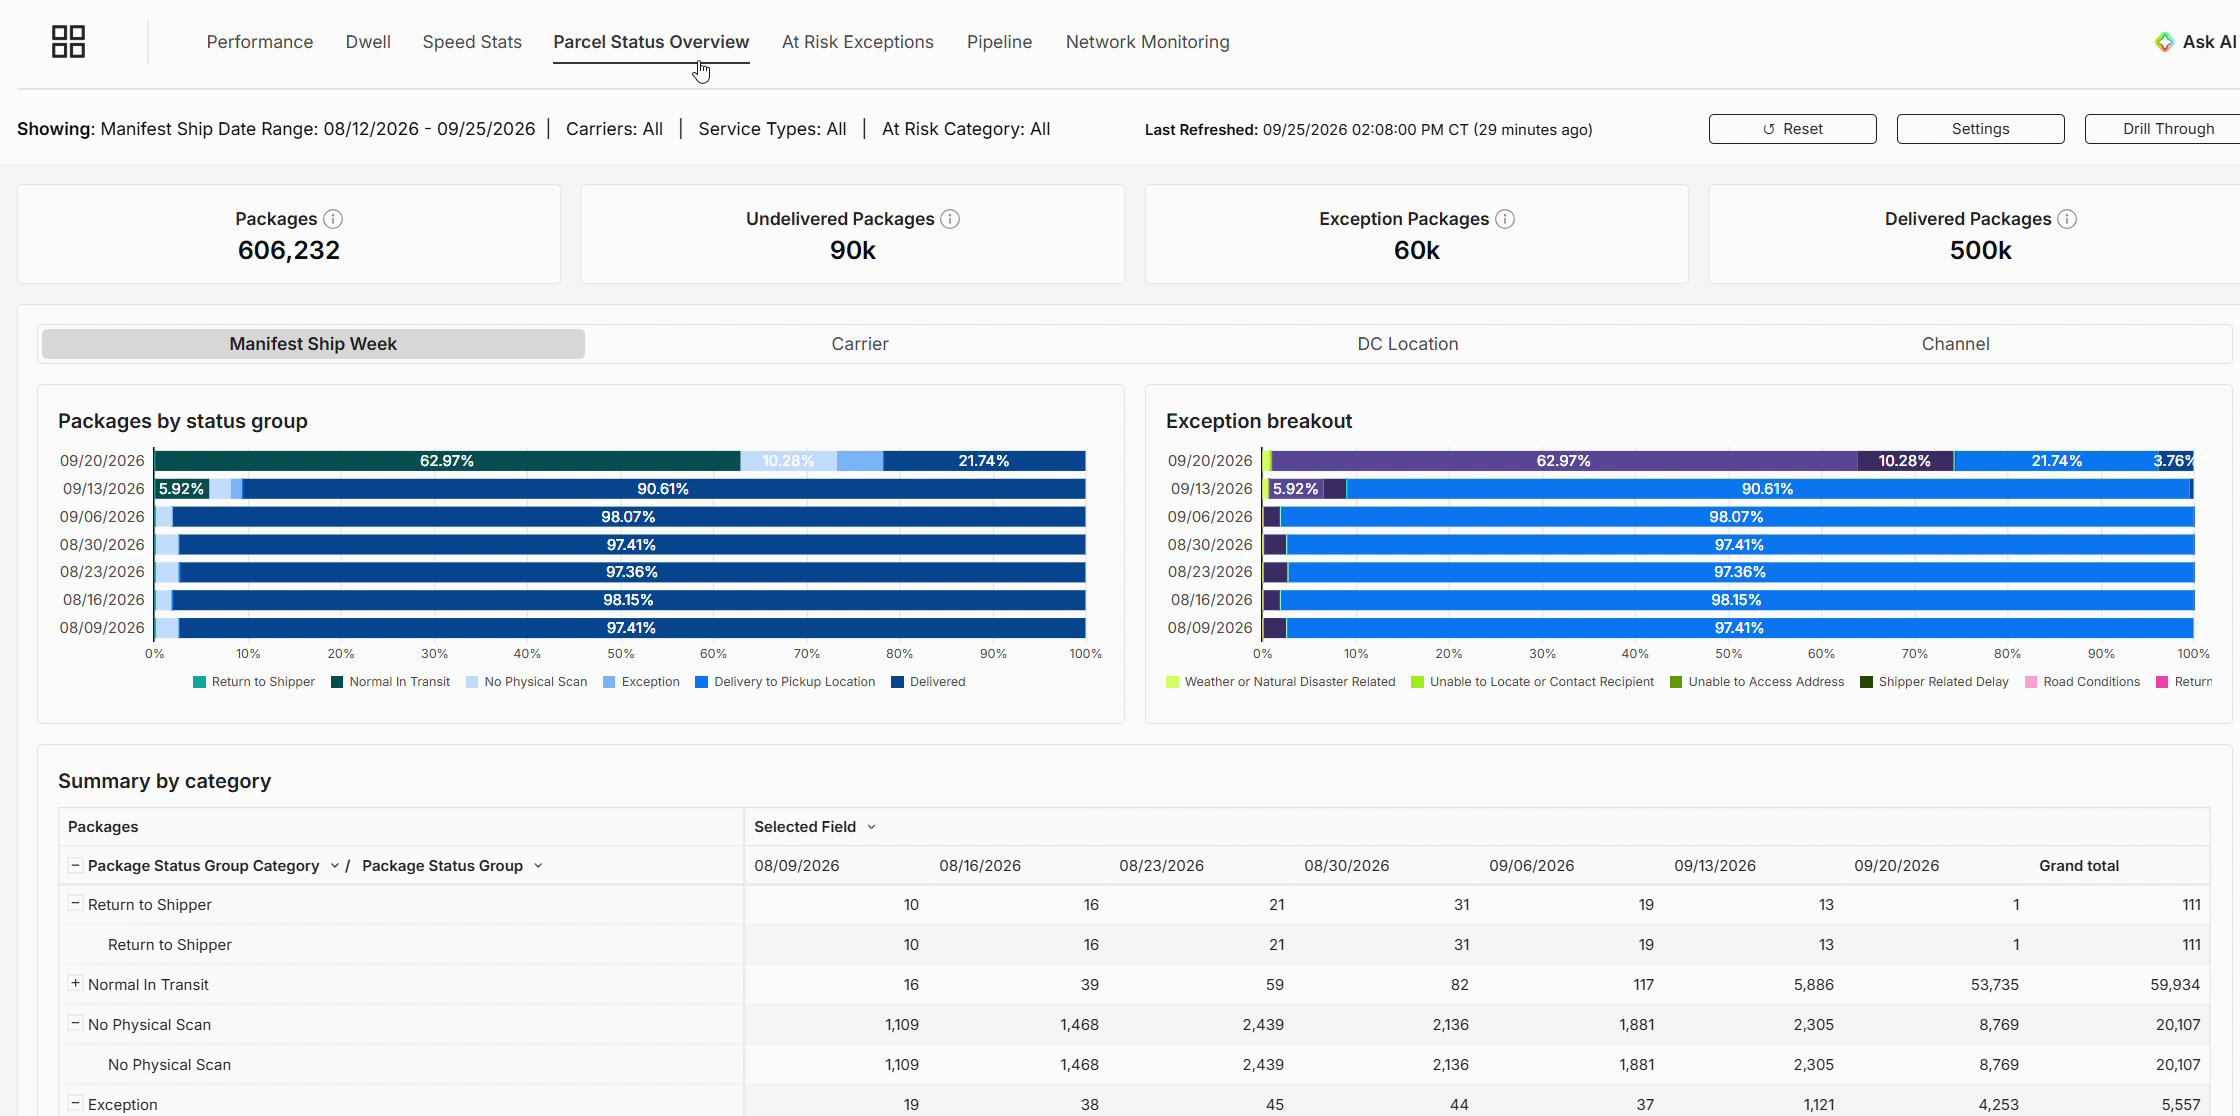
Figure 11. Packages by status group, exception breakout and summary by category.
The Exception breakout chart shows the exception types tracked (such as weather-related, unable to locate recipient, unable to access address and shipper-related delay) by manifest ship week. You can also view both charts by Carrier, DC Location or Channel.
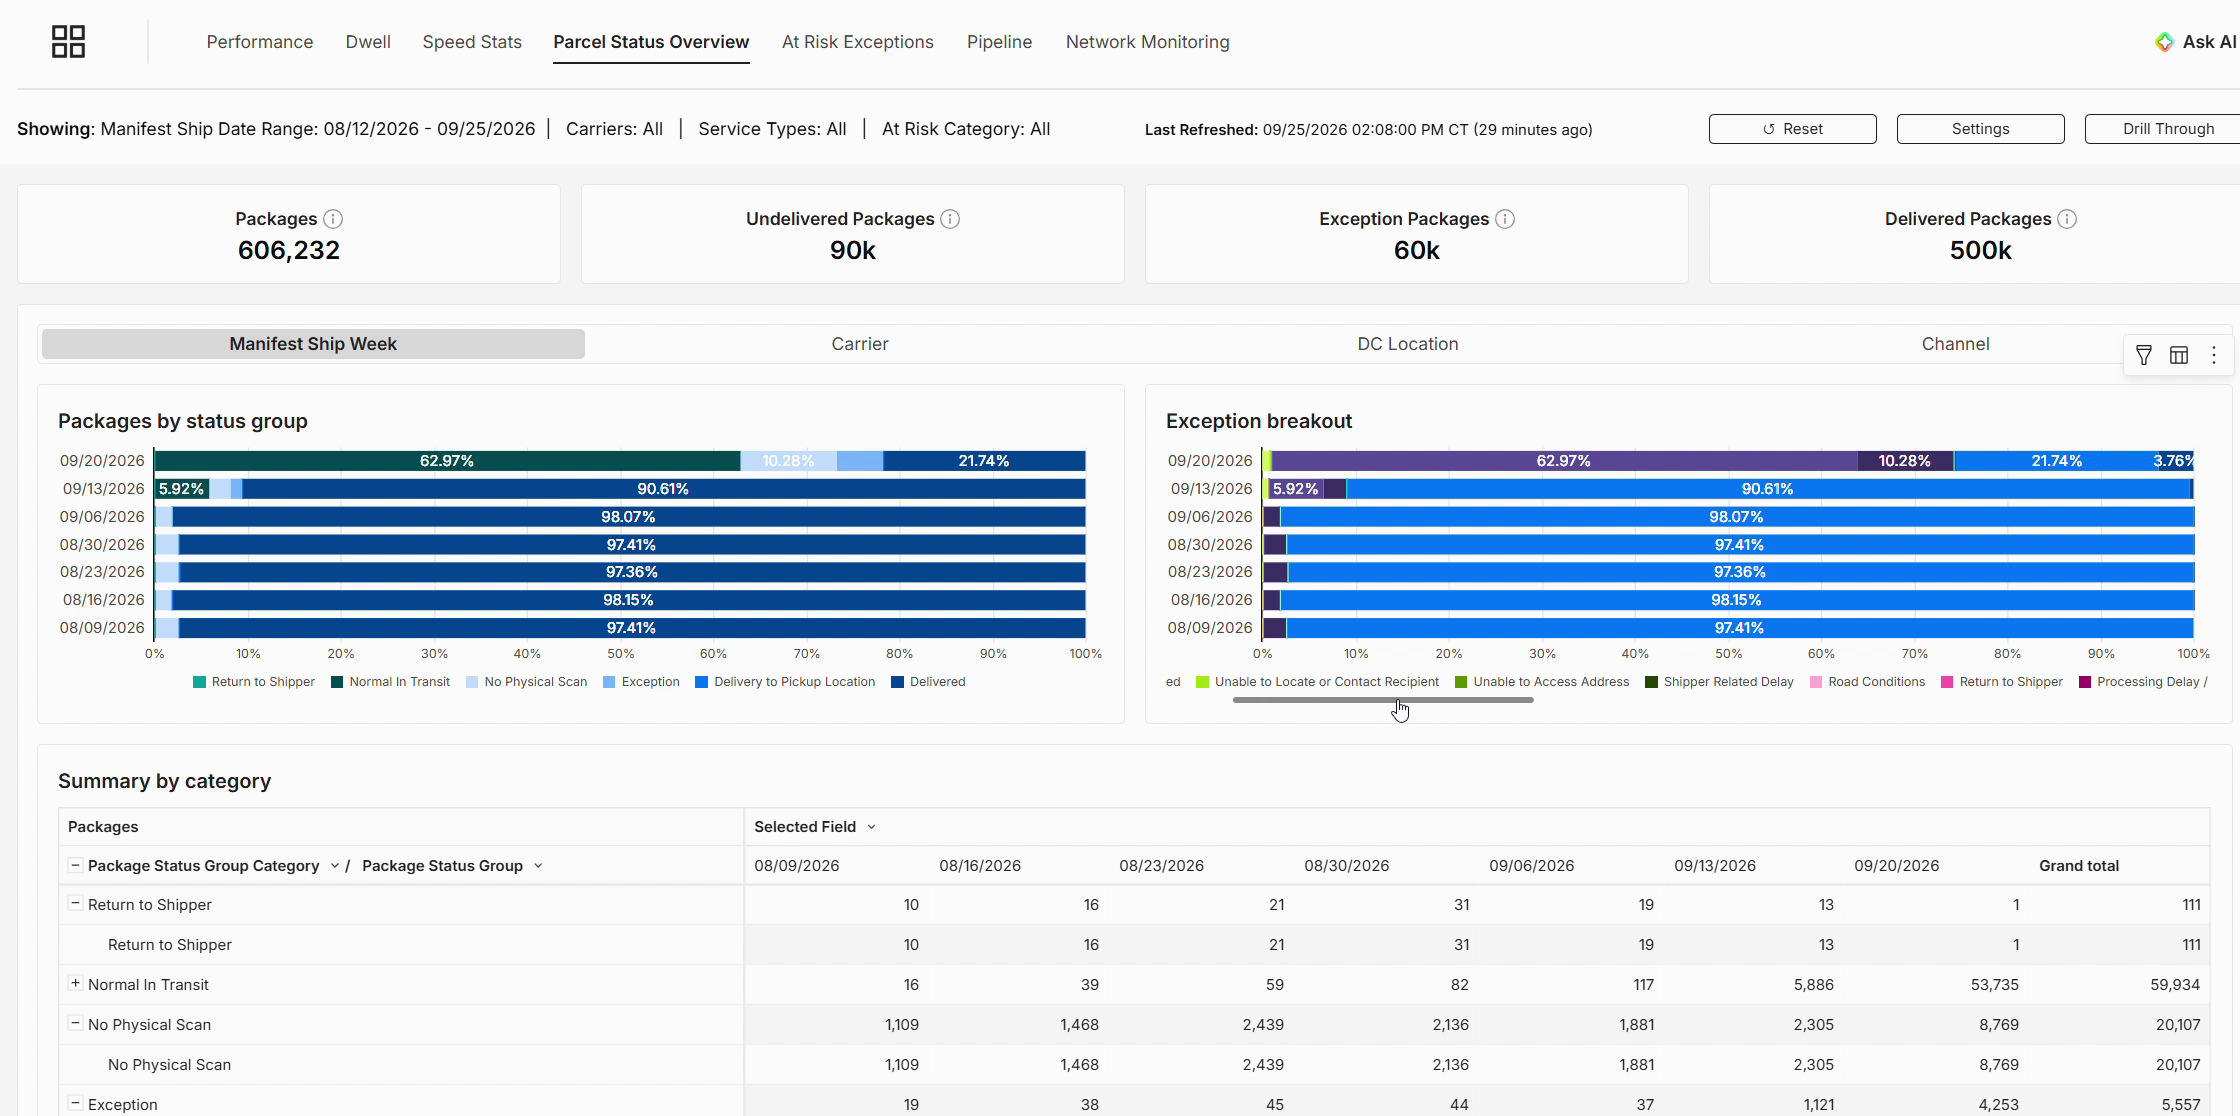
Figure 12. The Exception breakout chart.
Tip: expand any chart
To get a closer look at any chart, hover over it, click the ⋮ menu in its top-right corner and choose Maximize element.
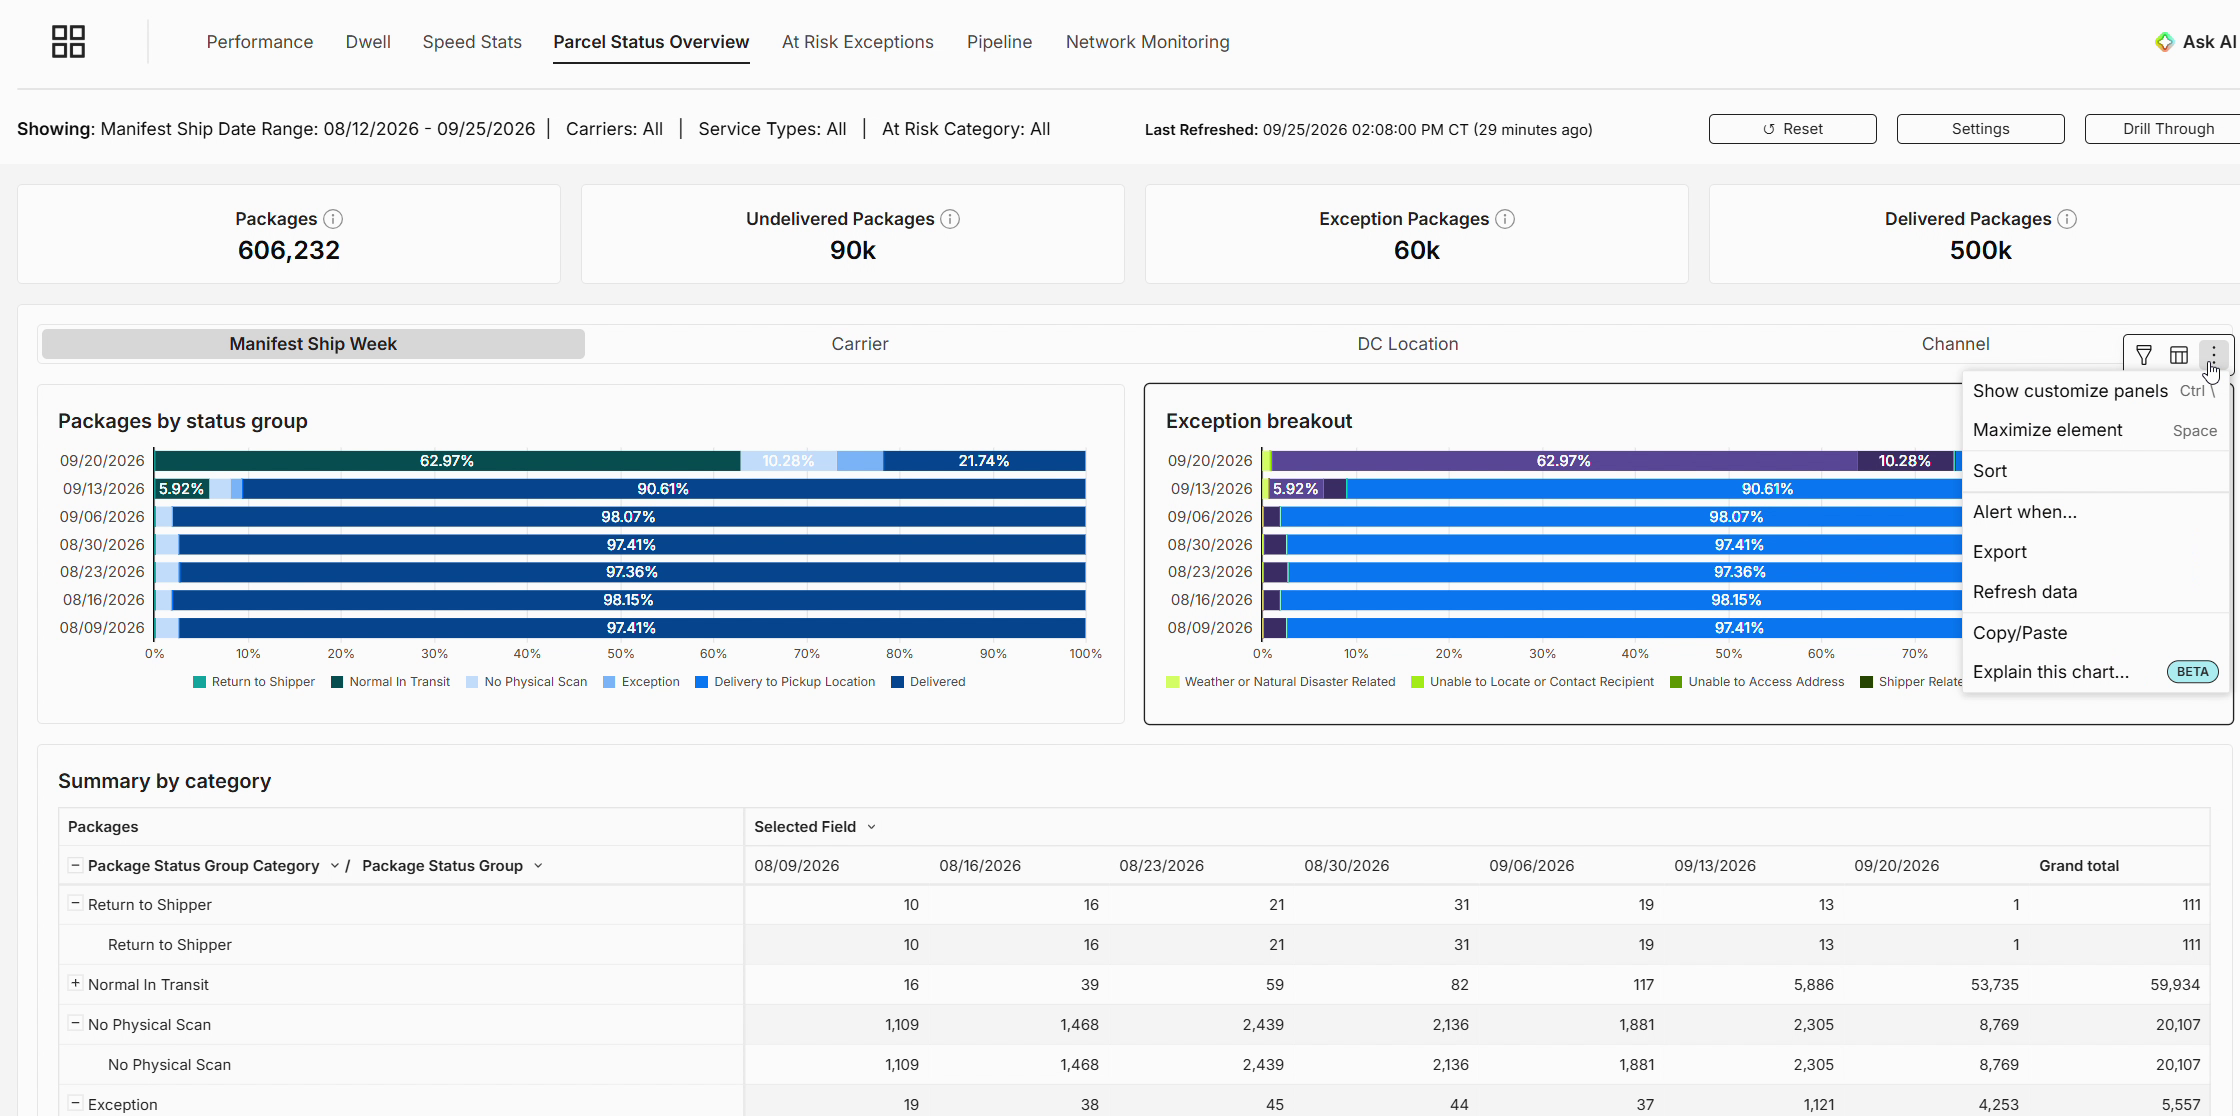
Figure 13. The element menu with the Maximize element option.
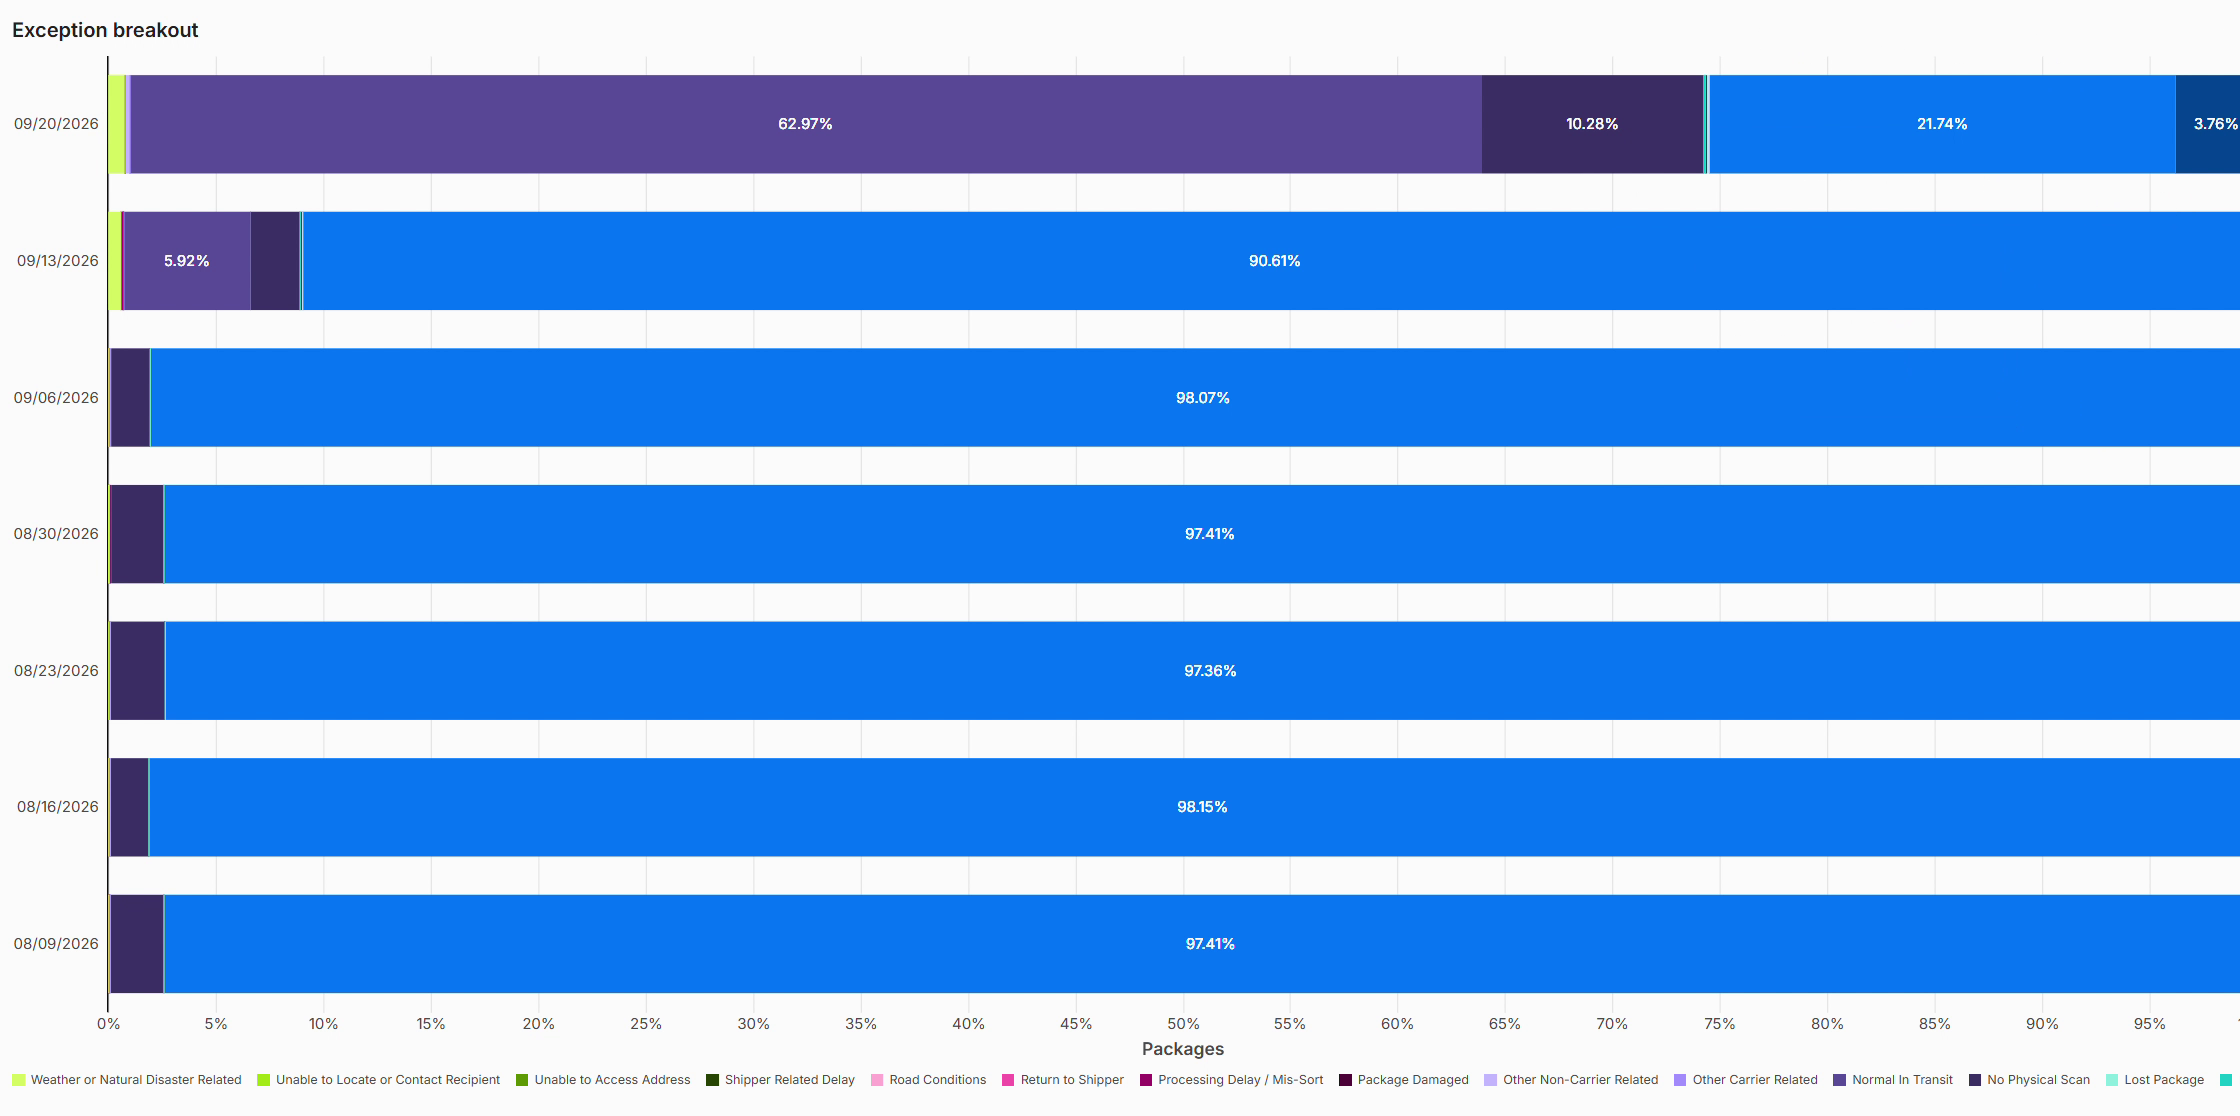
Figure 14. A maximized chart.
7. At Risk Exceptions
At Risk Exceptions looks at recently shipped packages with commit dates in the current or previous week. It sorts them into buckets based on how likely they are to miss their commit date, the date you promised the customer.
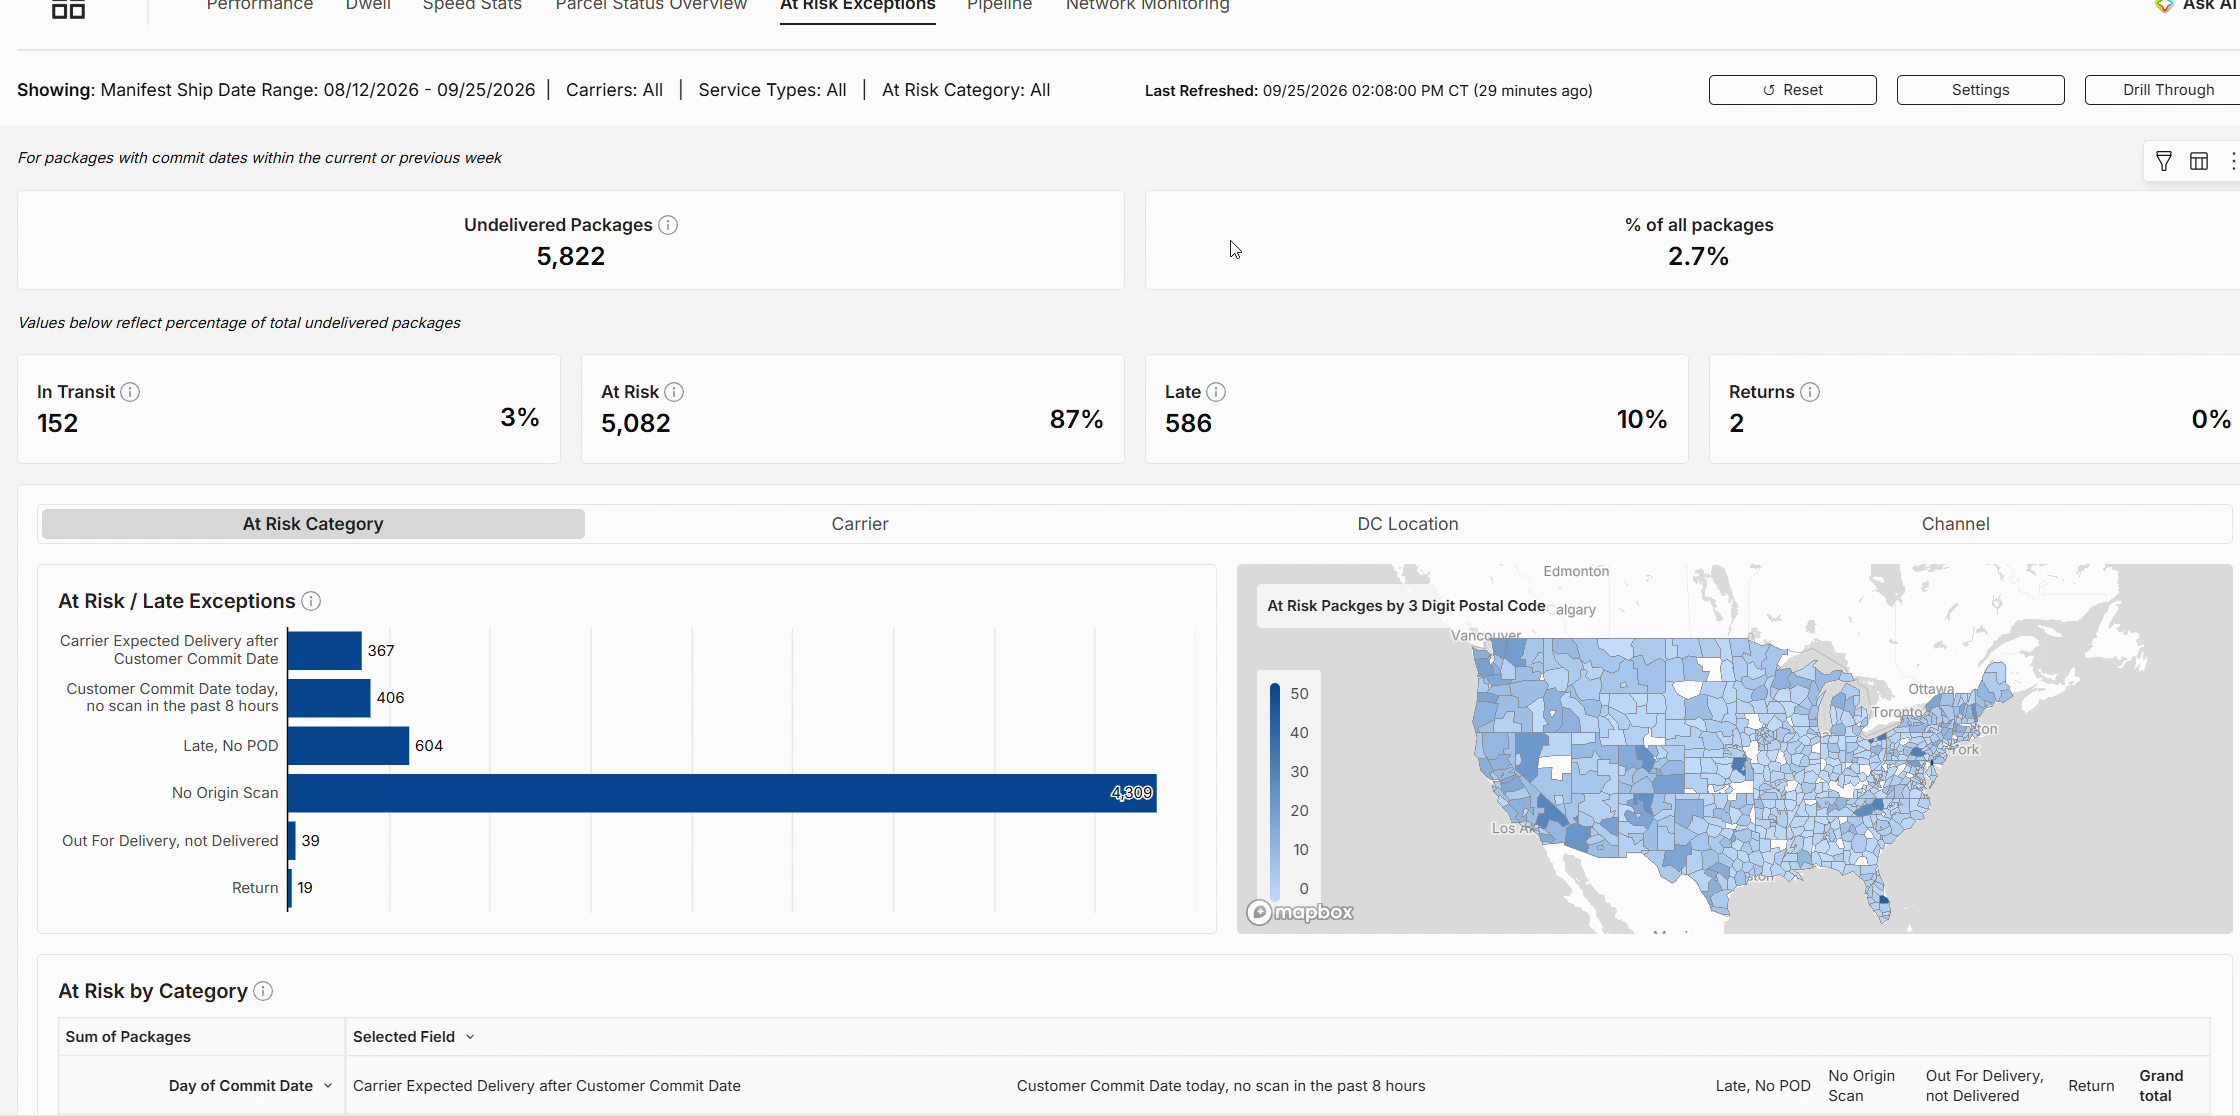
Figure 15. At Risk Exceptions: at-risk / late exceptions by category and the at-risk map.
At-risk category | What it means |
No Origin Scan | The package hasn't had its origin scan yet, so it's most likely still in the dwell period. |
Late | The package has already missed its commit date. |
Customer commit date today, no scan in the past 8 hours | It's due today but hasn't been scanned recently. |
Carrier EDD after customer commit date | The carrier's expected delivery date is later than the date you promised, so the package is very likely to arrive late. |
The At Risk by Category table below the chart breaks the counts out by commit date.
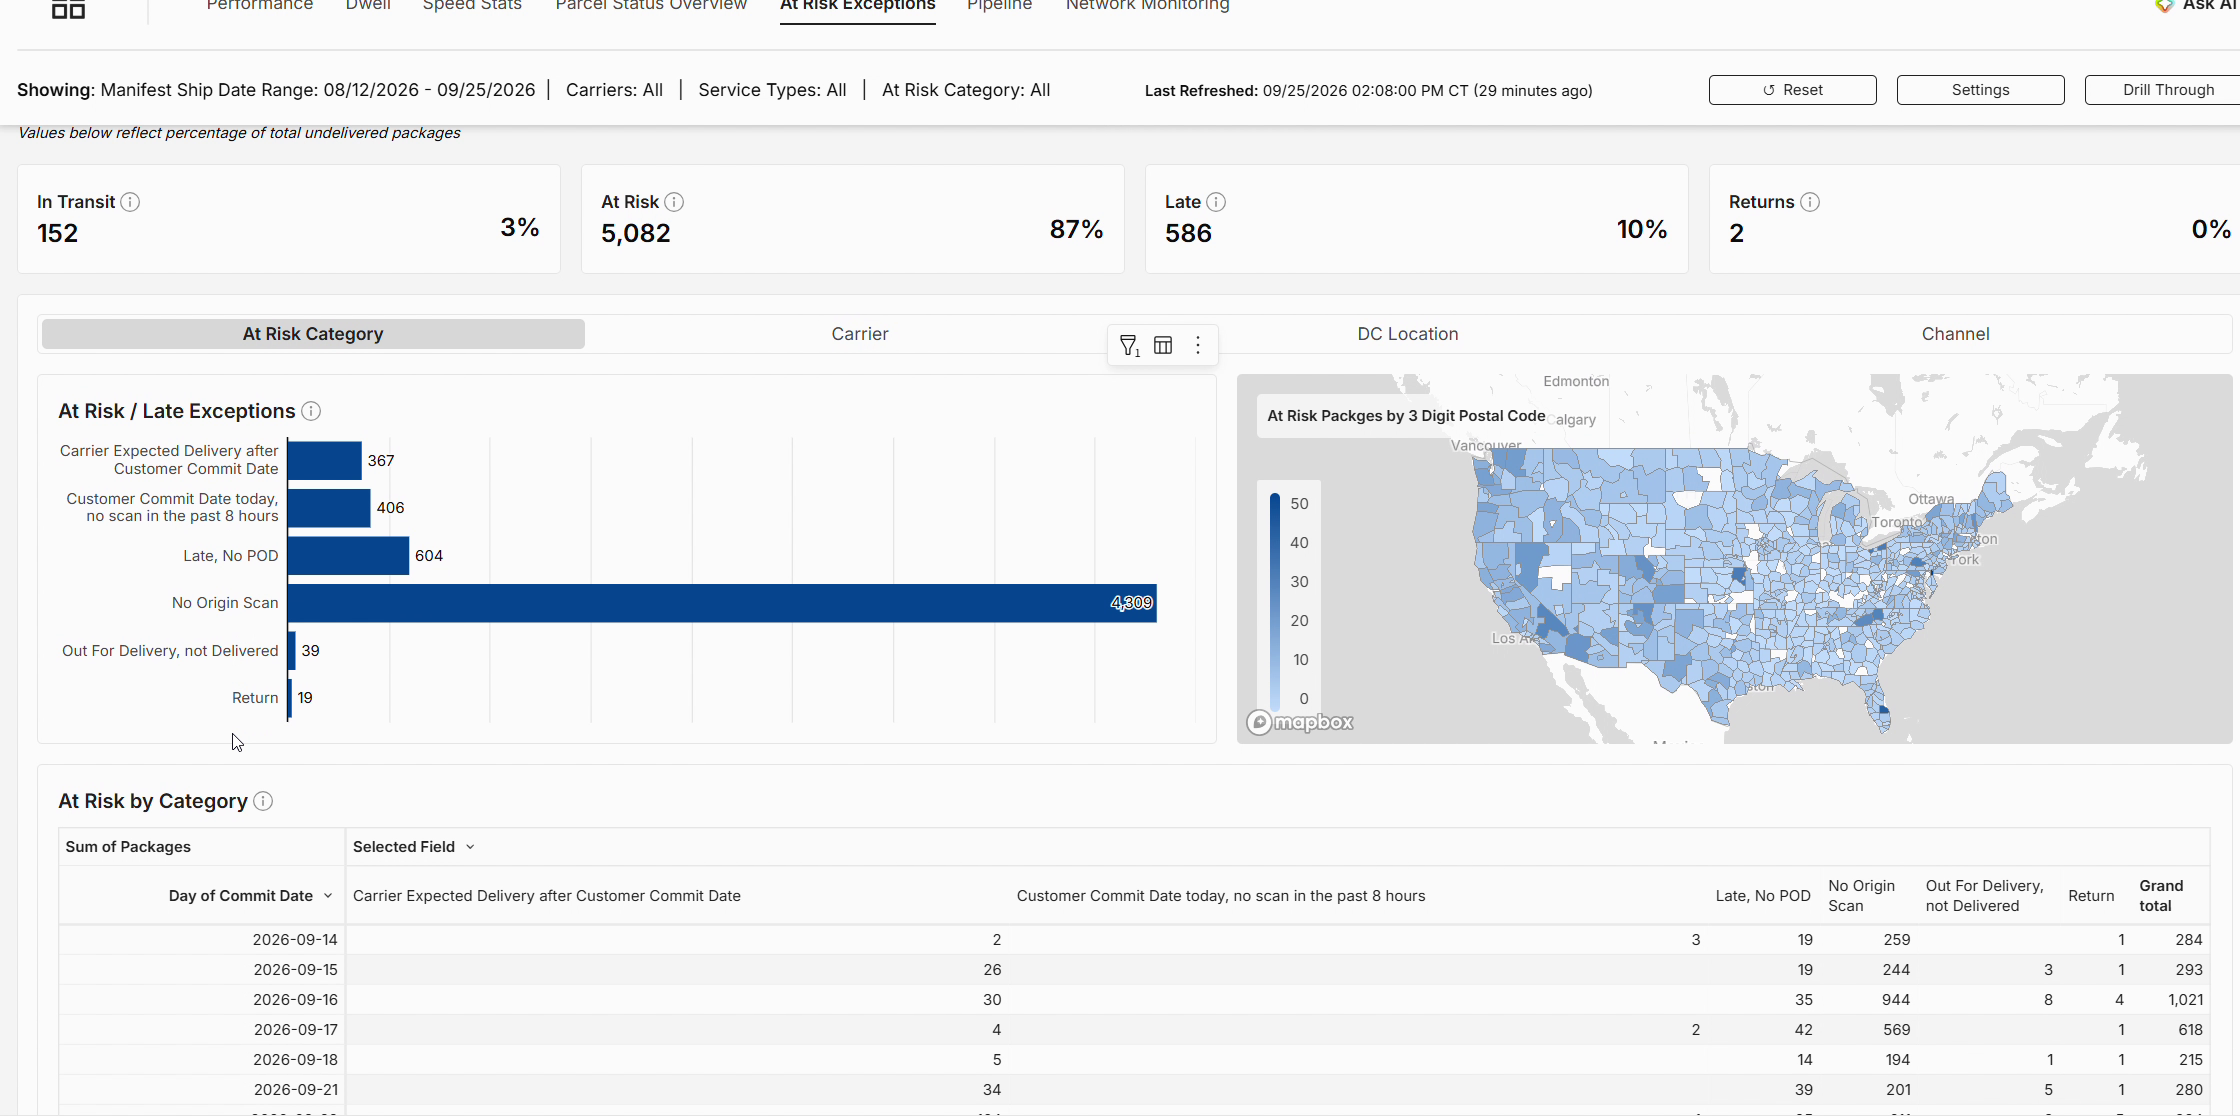
Figure 16. At Risk by Category table.
8. Pipeline
The Pipeline report shows trends over time for:
· Total packages, delivered packages and physical scan %
· Commit performance and First / Last EDD performance
· Order to Ship, Ship to Delivery and Order to Delivery days
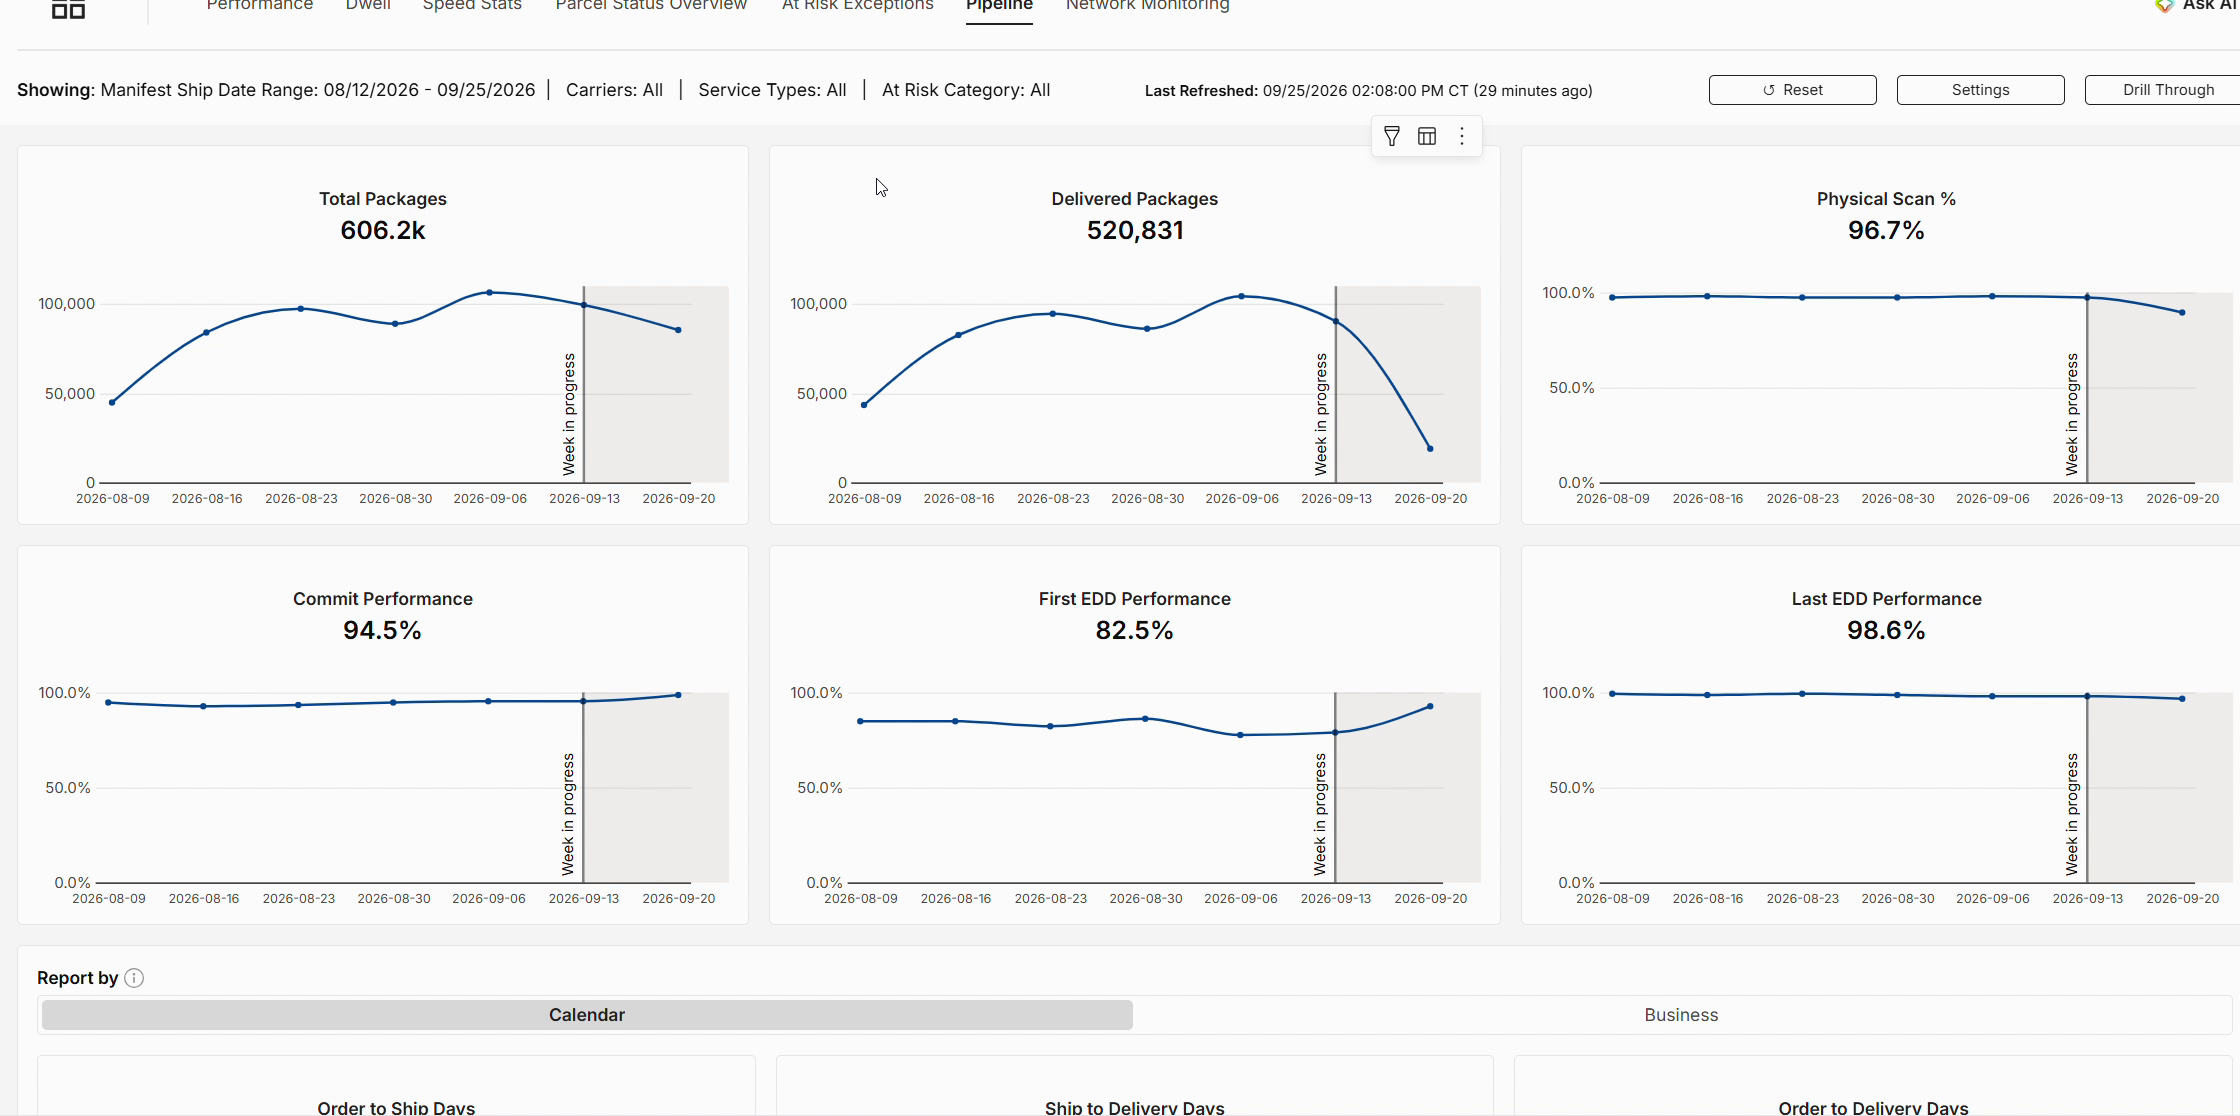
Figure 17. Pipeline volume, scan rate and performance trends.
As on Speed Stats, use the Calendar / Business toggle to switch how transit days are measured.
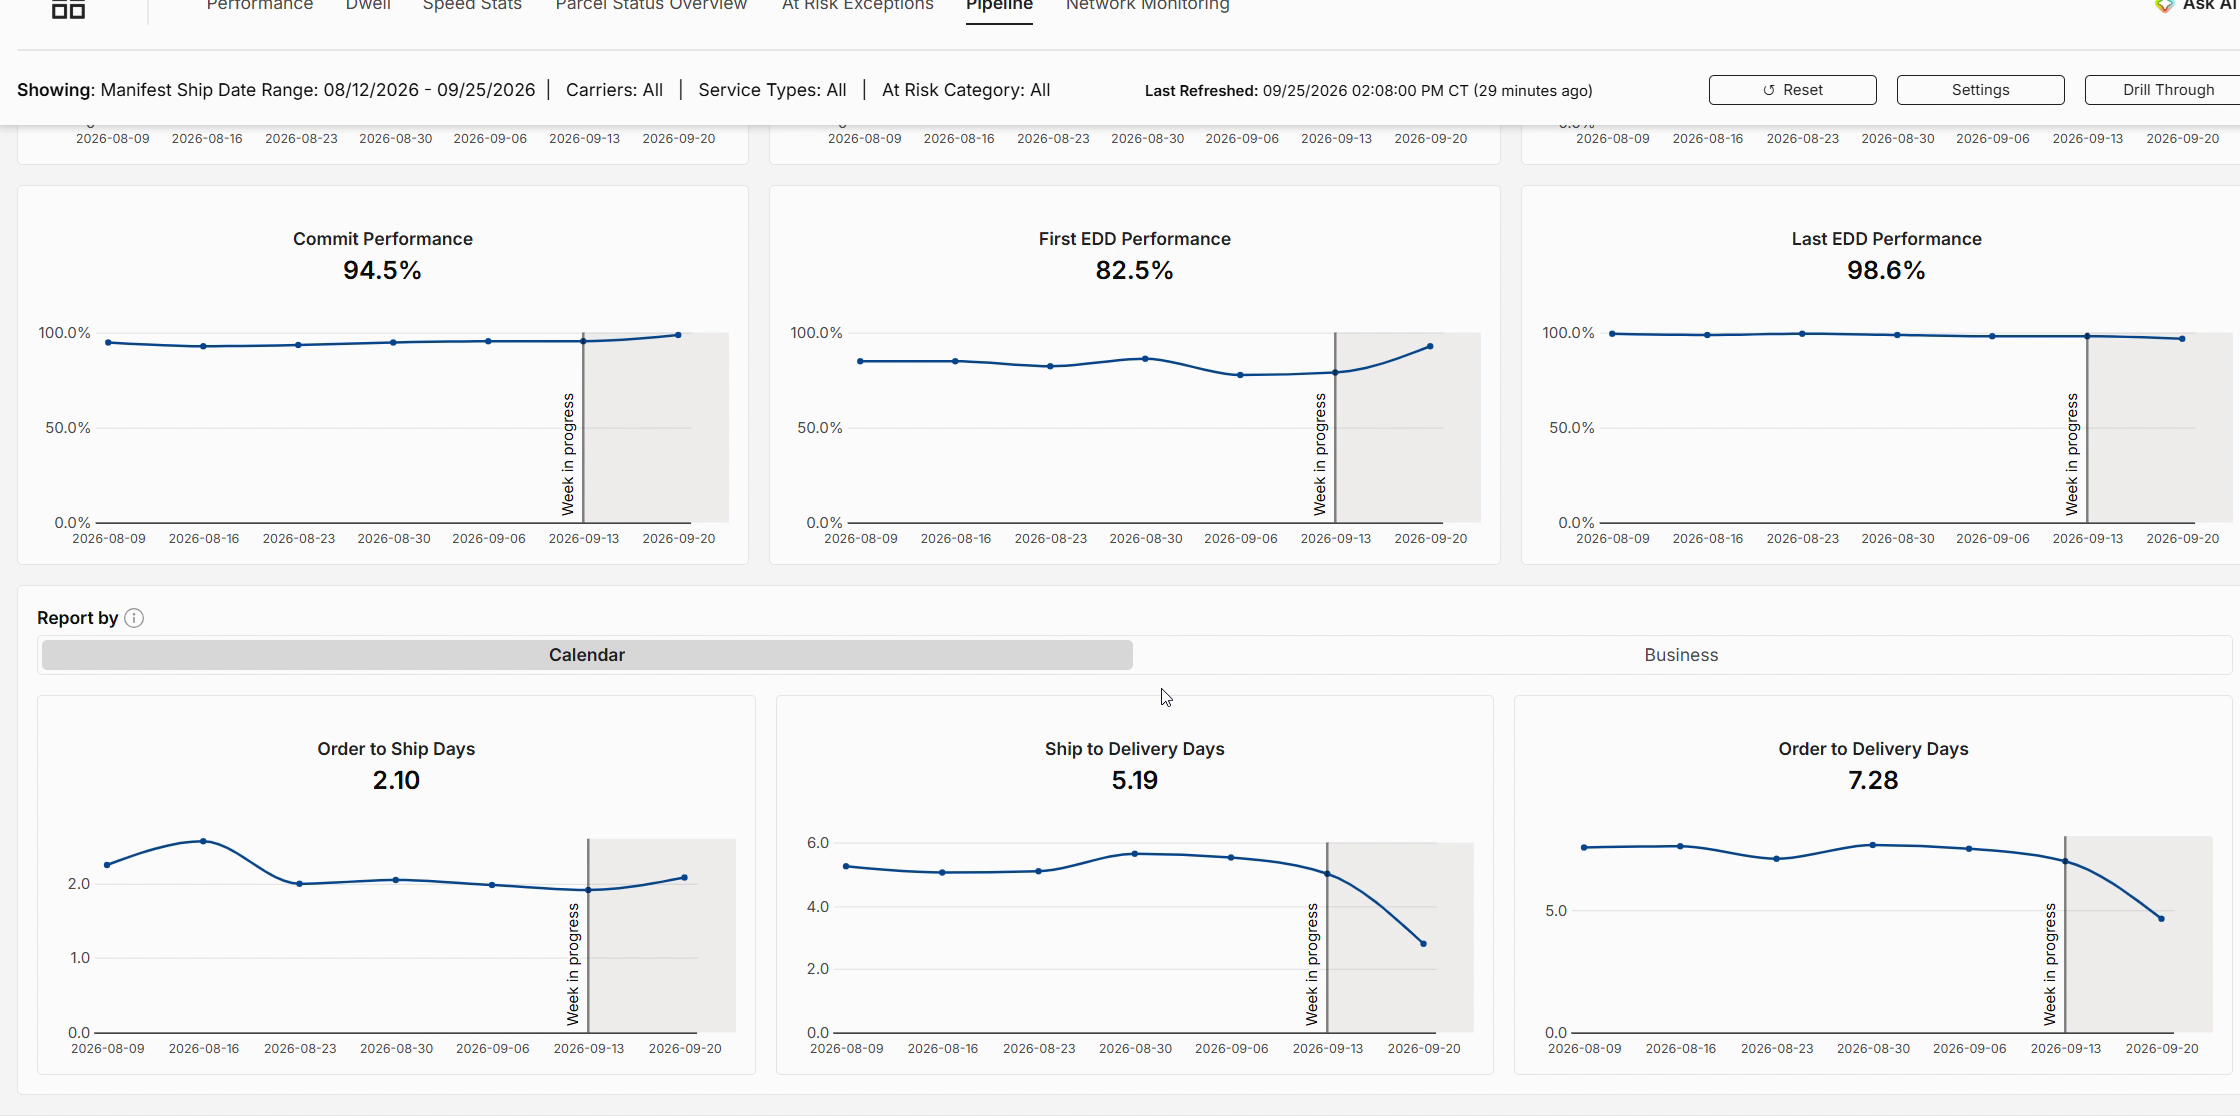
Figure 18. Pipeline transit metrics with the Calendar / Business toggle.
9. Network Monitoring
Network Monitoring is the most detailed page. It covers packages shipped in the last 45 days. At the top level it measures packages with no physical scan and packages that are still undelivered, overall and by carrier.
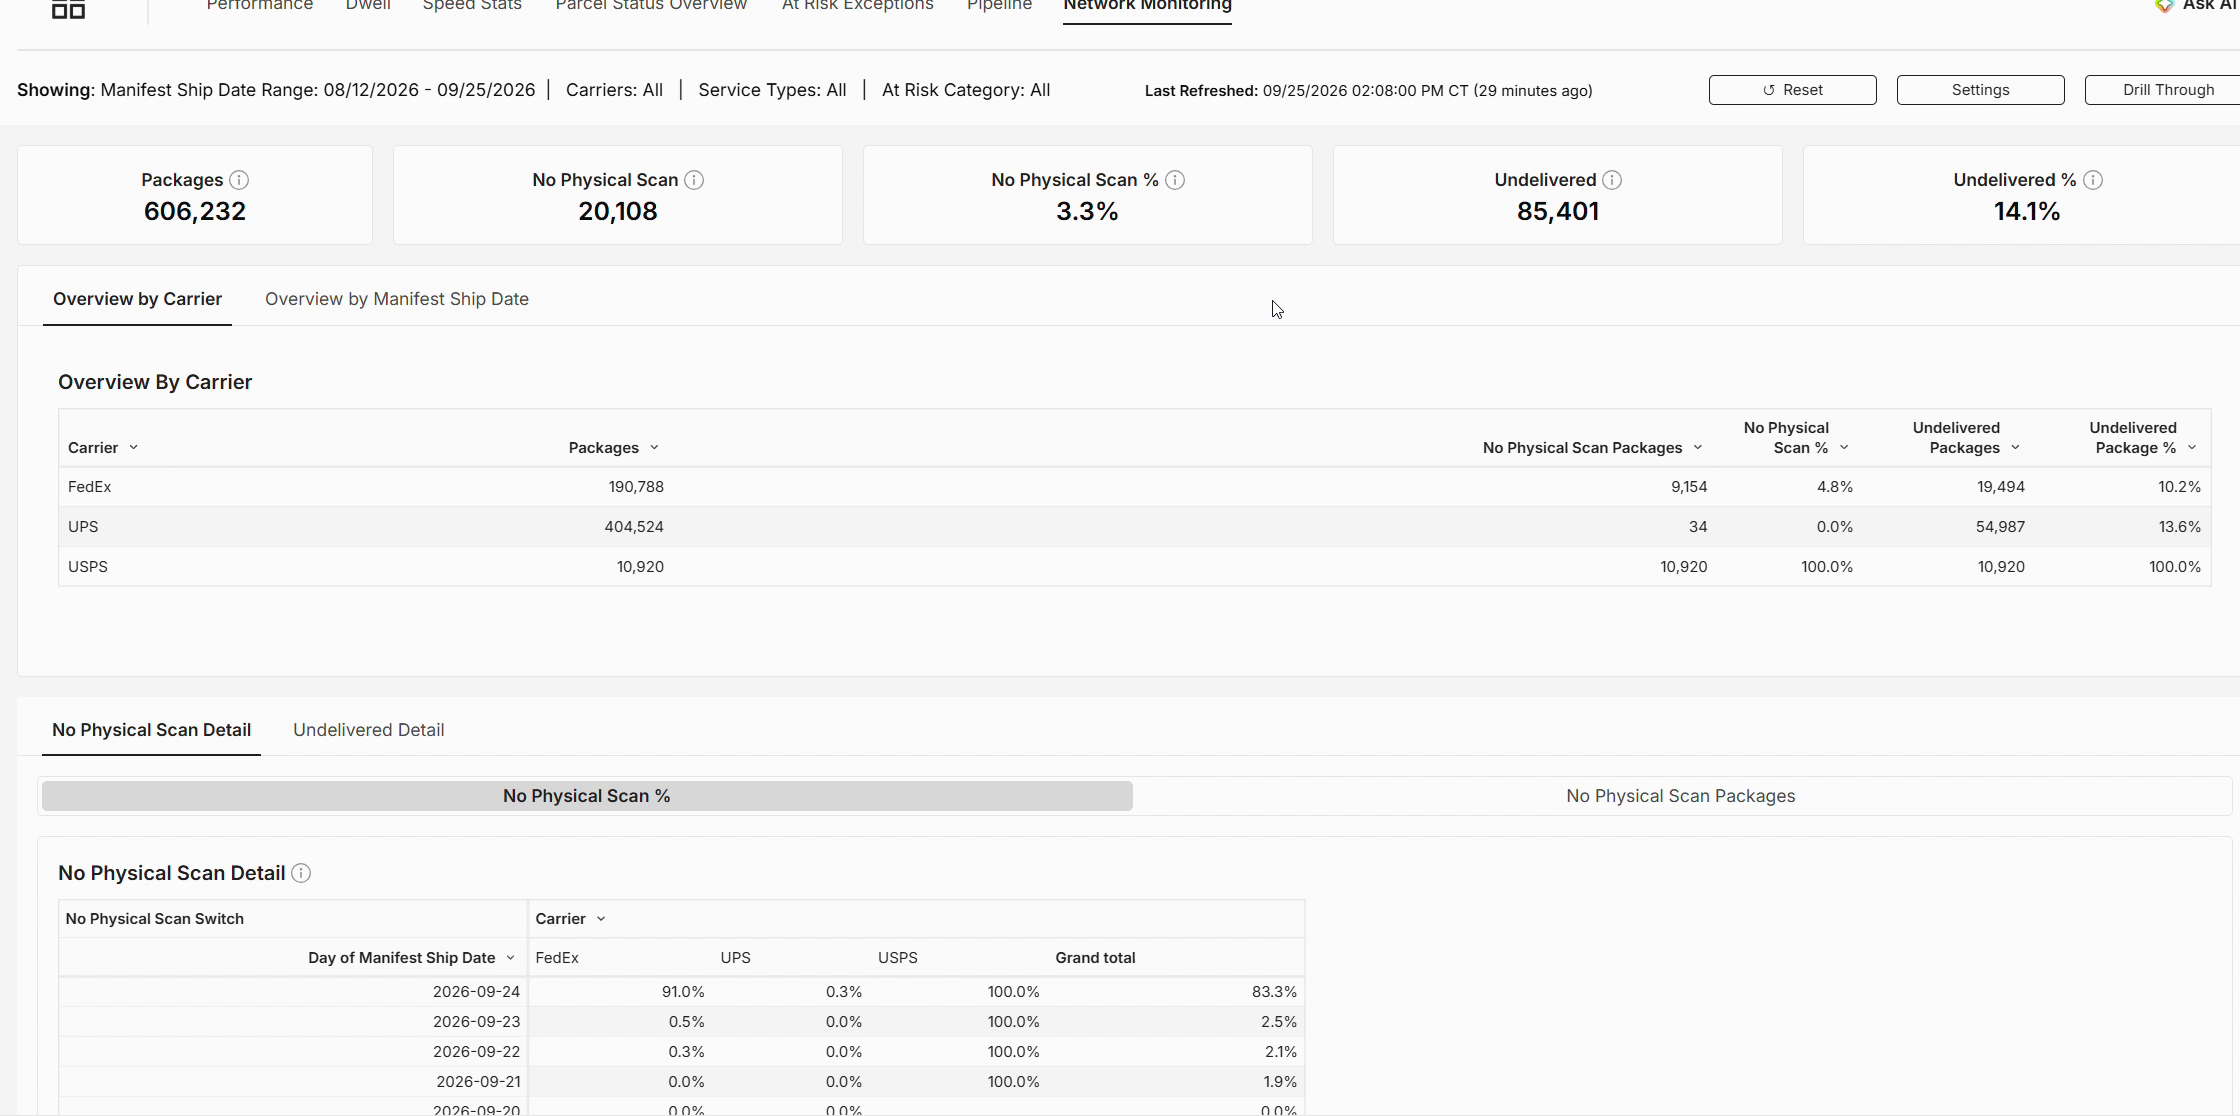
Figure 19. Network Monitoring overview by carrier.
No Physical Scan and Undelivered detail
Use the No Physical Scan Detail and Undelivered Detail tabs to see these packages by day and carrier. The toggle switches between a percentage and a package count.
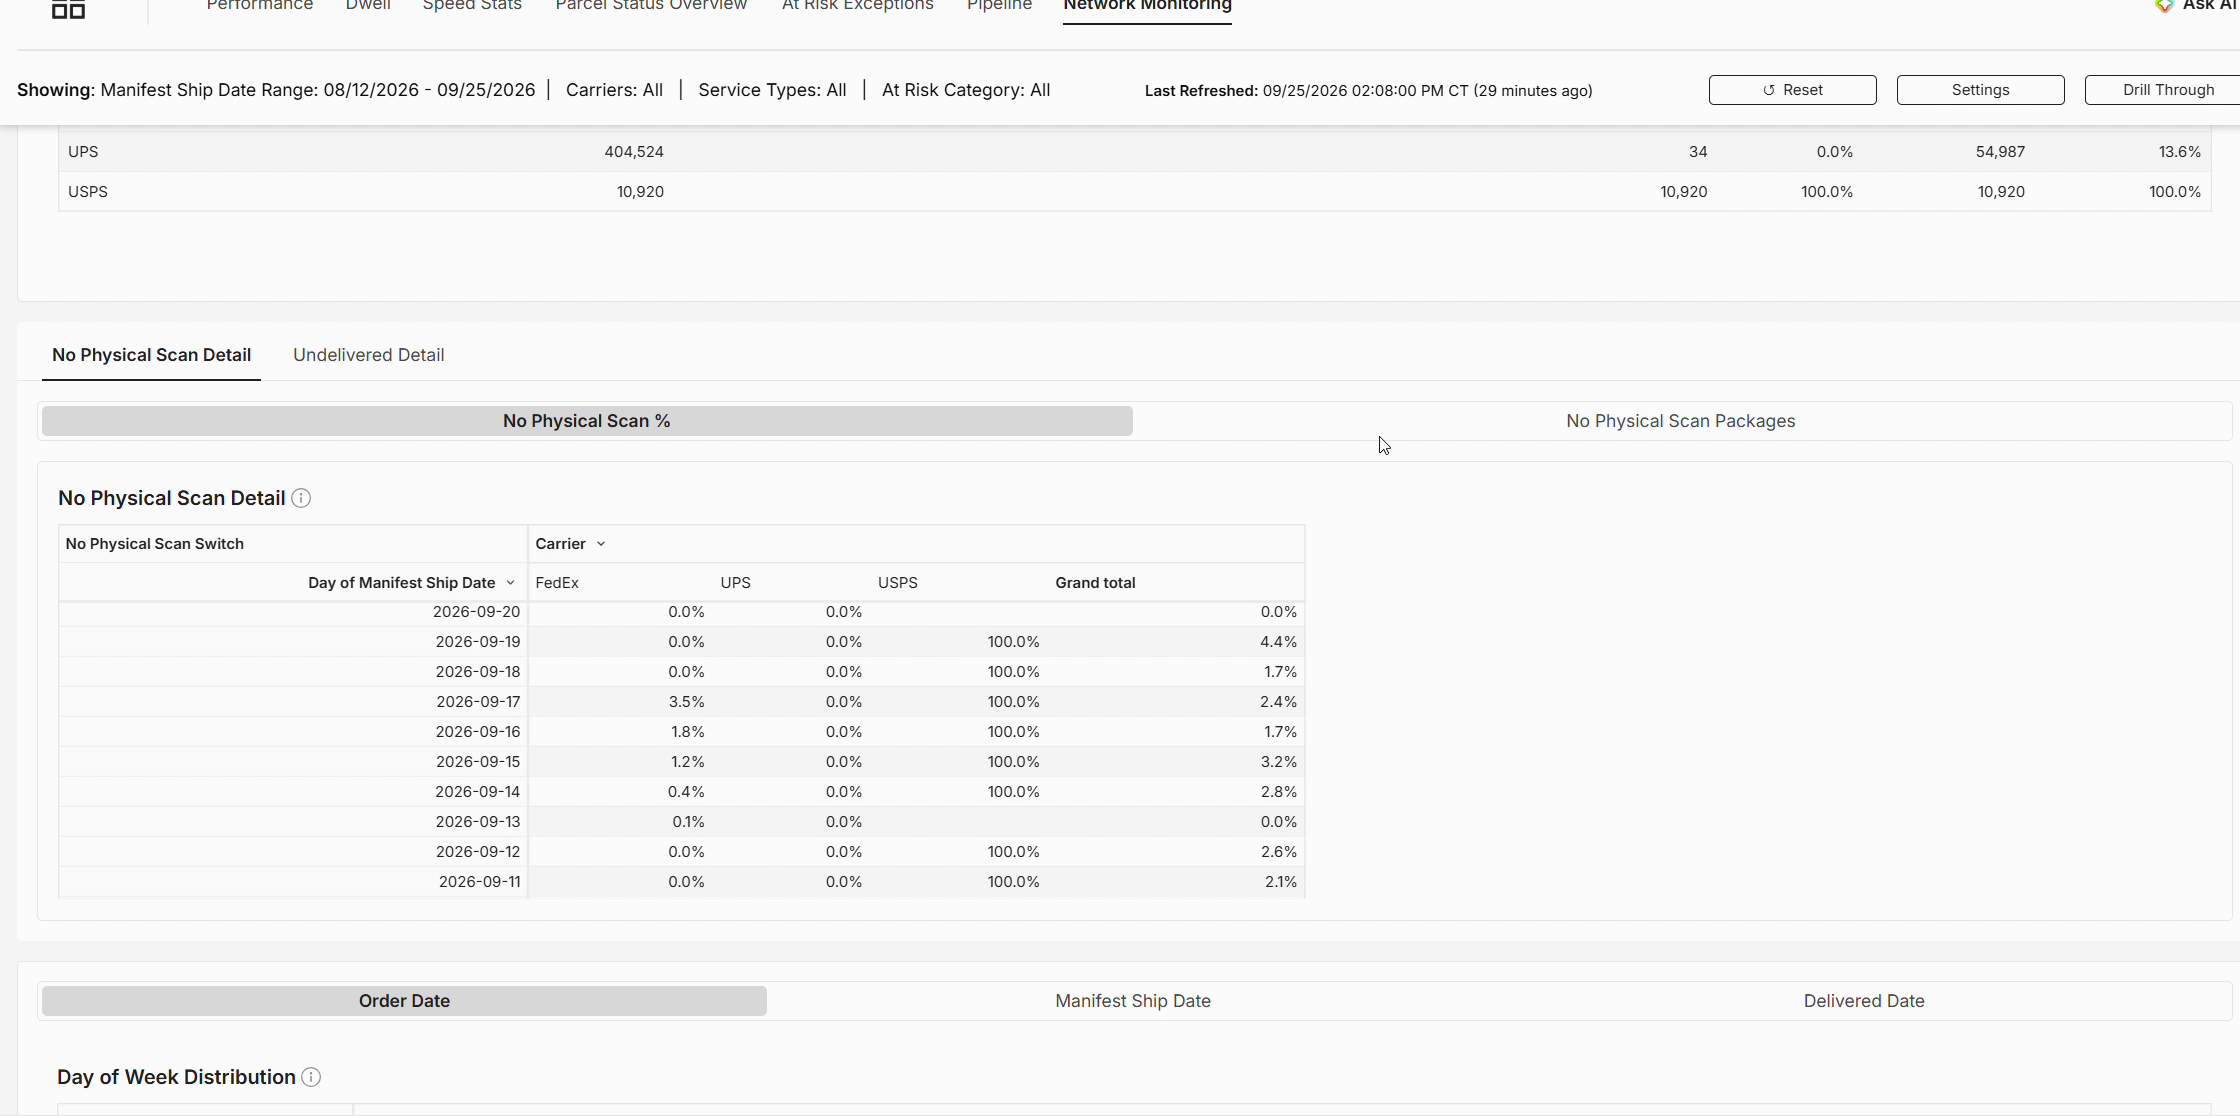
Figure 20. No Physical Scan detail by day, with the % / package count toggle.
Day of week distribution
The Day of Week Distribution table shows which days of the week your orders are placed, packages ship or packages deliver. Switch between Order Date, Manifest Ship Date and Delivered Date.
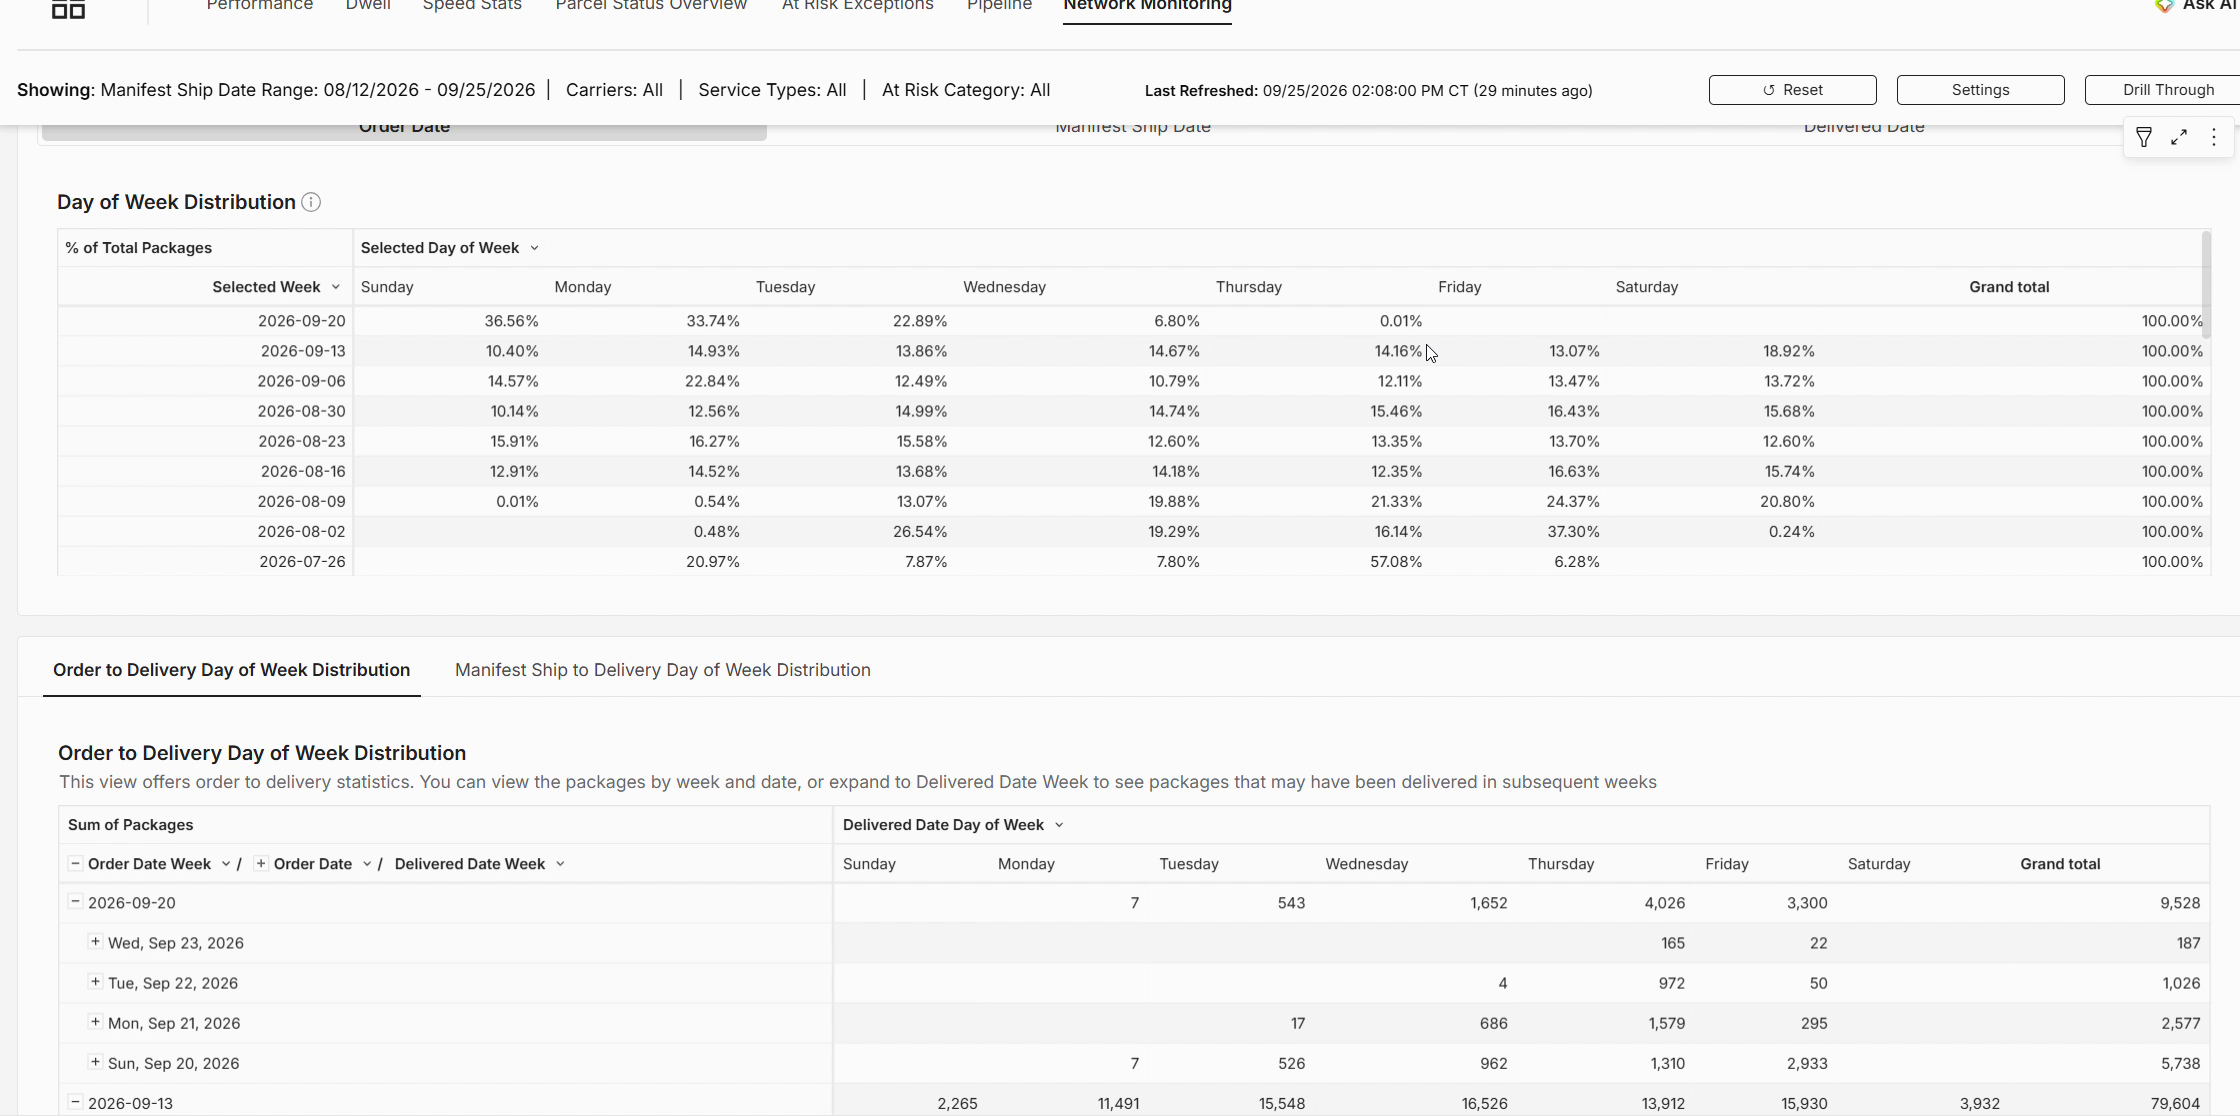
Figure 21. Day of Week Distribution.
The Order to Delivery Day of Week Distribution tracks each order date (week and day) through to its delivered date. For example, it shows that most packages ordered on the 23rd were delivered that Thursday, and how that changes week to week. A second tab gives the same view from manifest ship to delivery.
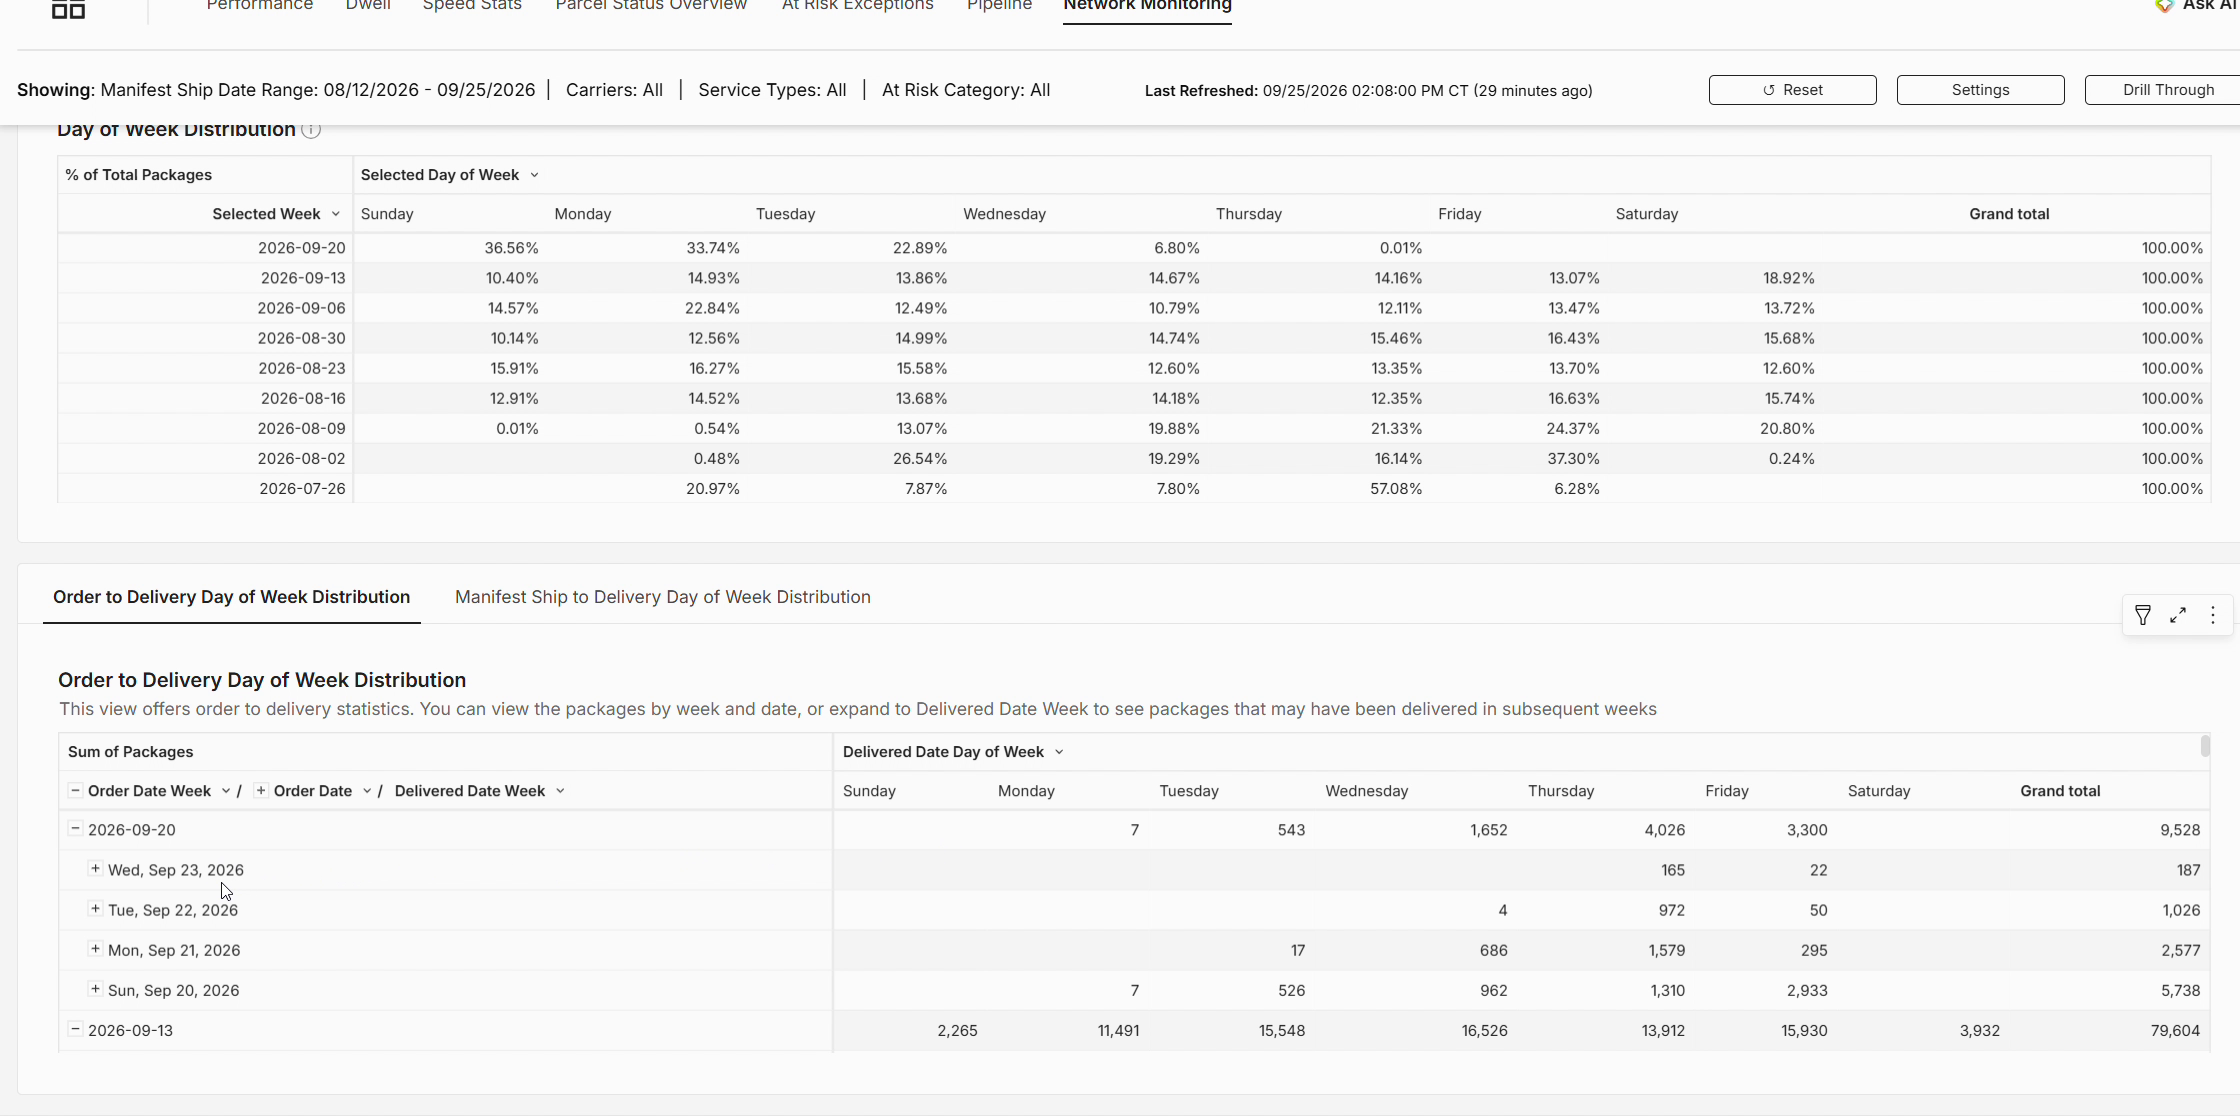
Figure 22. Order to Delivery Day of Week Distribution.
10. Drill Through & export
To see detail for individual packages, click Drill Through in the header bar. This opens a package-level table with filters for Carrier, Service Type, DC Location, Account Number, Channel, Merchandise Description, At Risk Category, Physical Scan, Commit Date On Time, Ship to State, Manifest Ship Date and Commit Date.
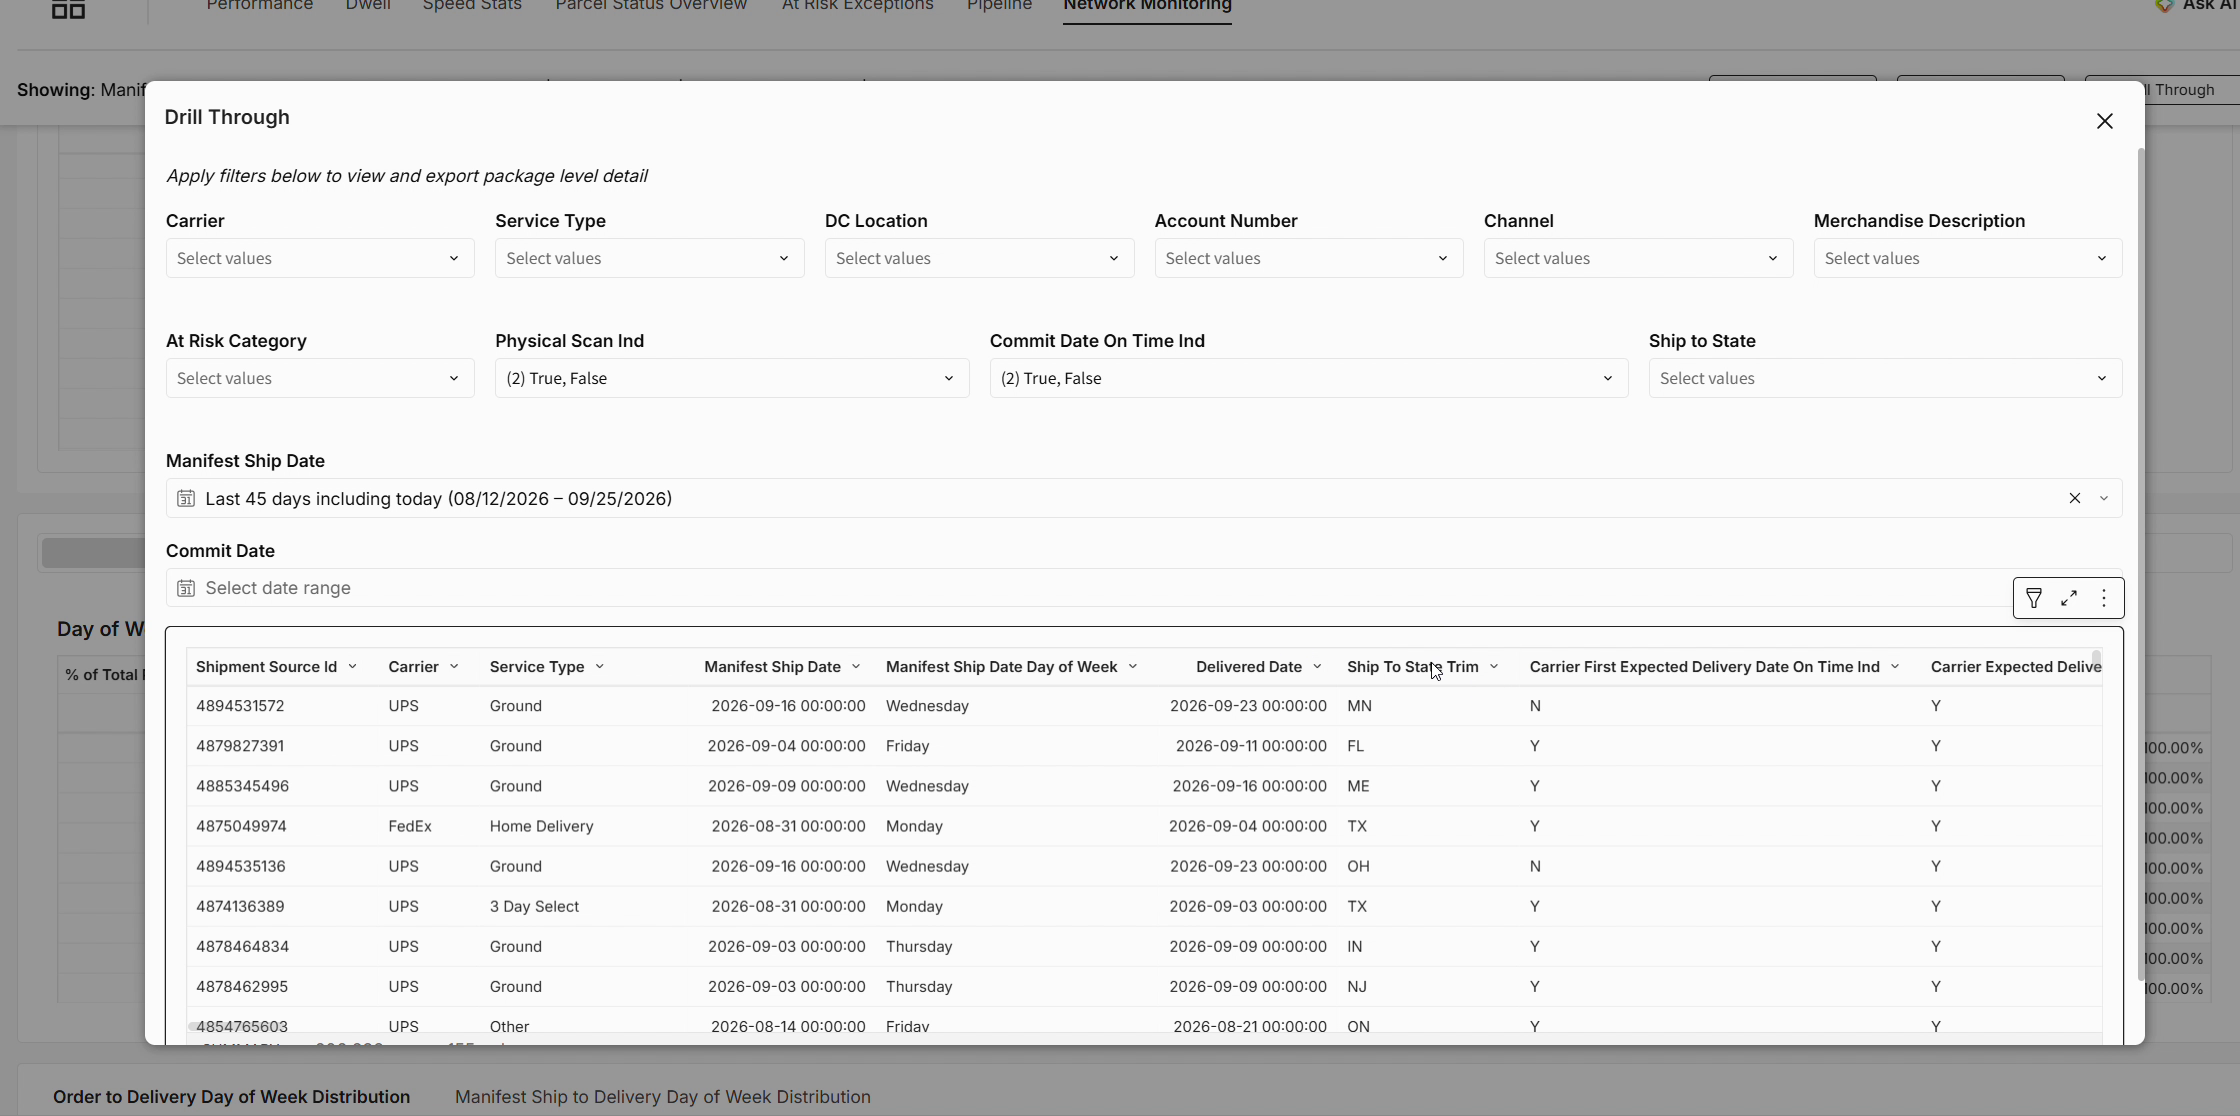
Figure 23. The Drill Through window with its filters and the package-level table.
To export the results, open the table's ⋮ menu, choose Export, then pick CSV, Excel, JSON or PDF. You can also send an export or schedule recurring exports.
Note: downloads are limited to 1 million rows. Narrow your filters first if you need a smaller, more focused extract. |
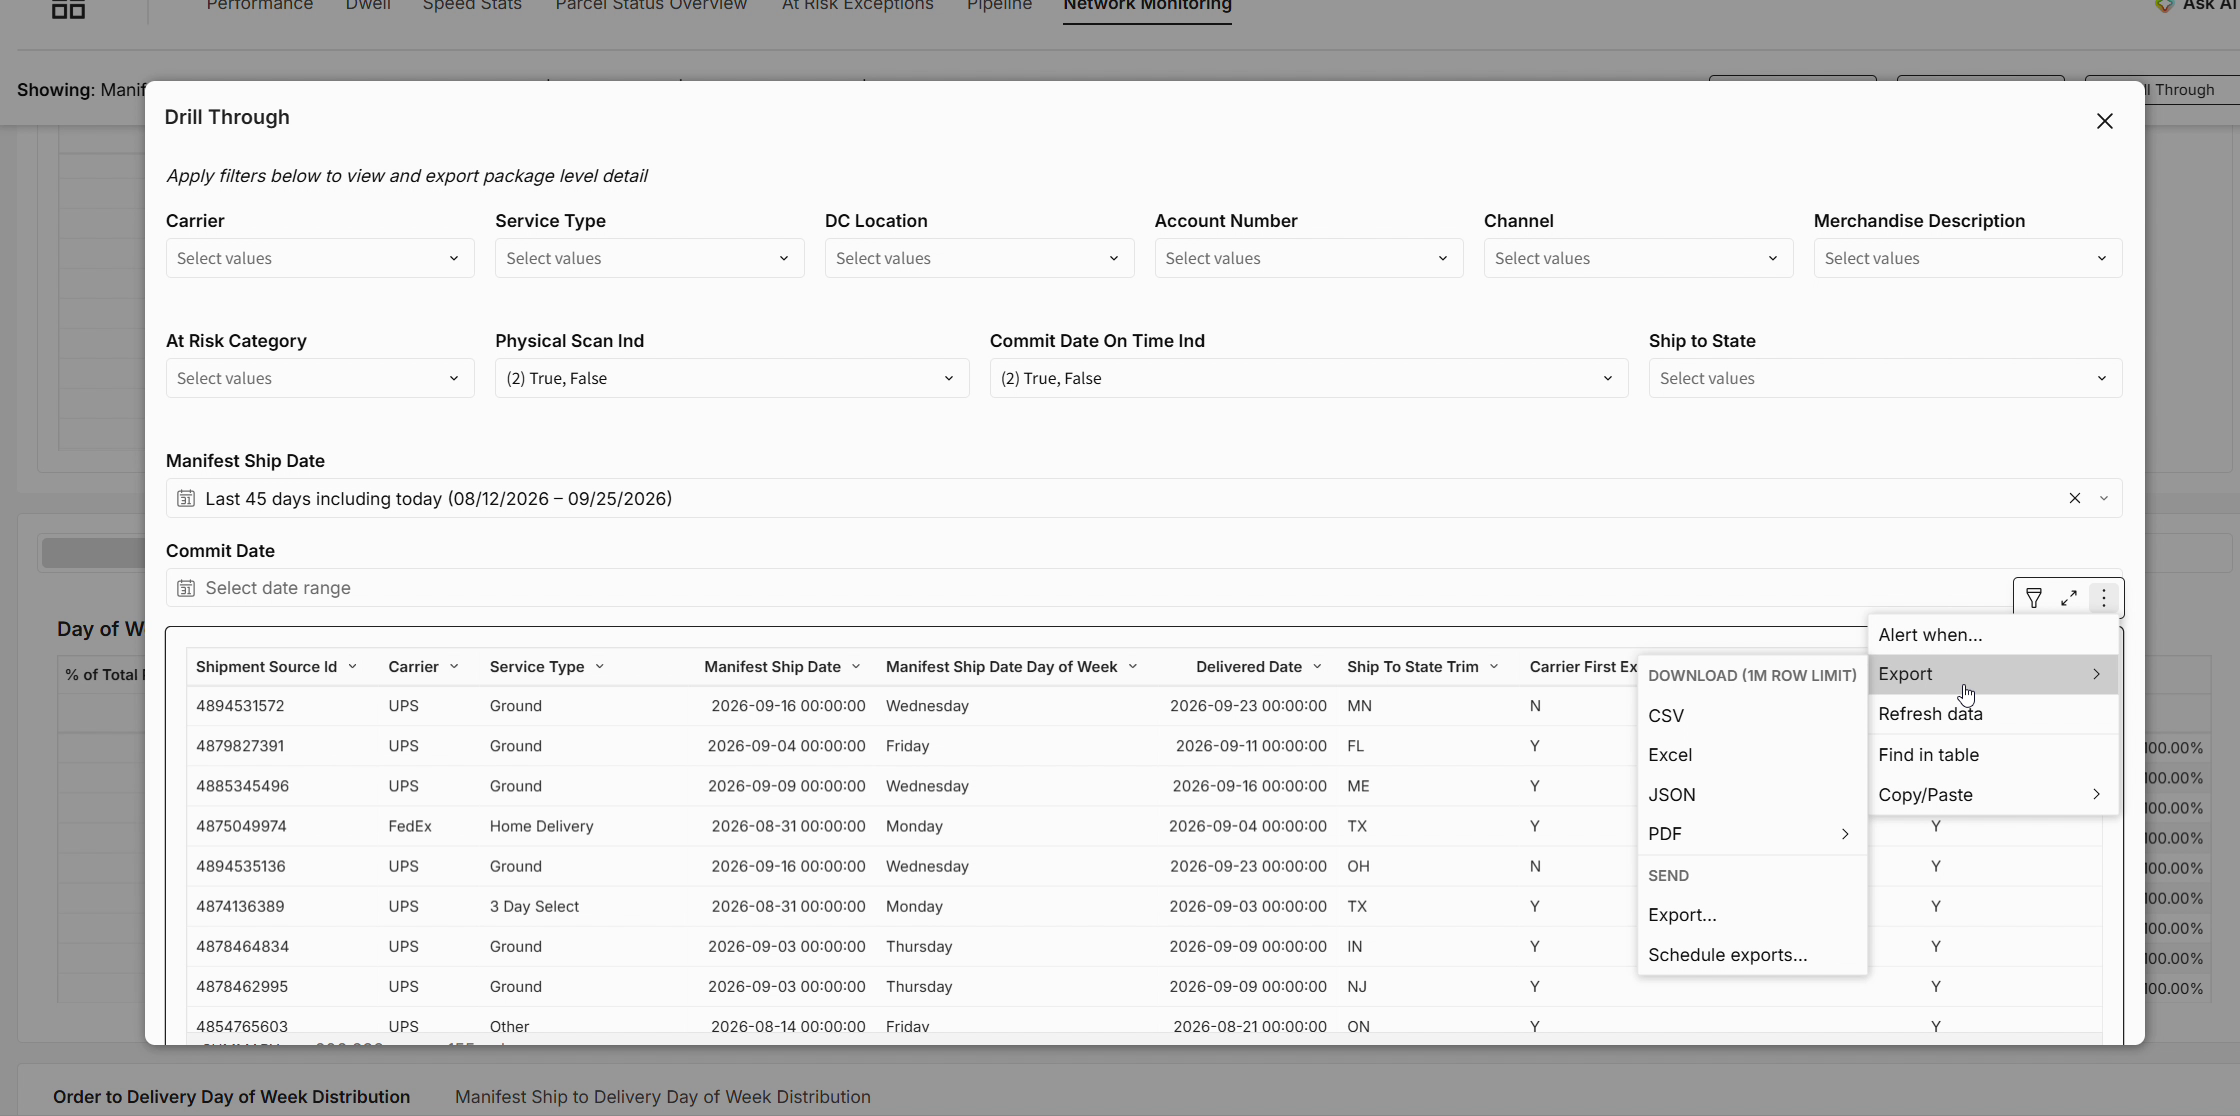
Figure 24. Export options from the Drill Through table.
11. Filtering the whole dashboard
To filter everything you're looking at, click Settings in the header bar. This opens Report Controls. Filters you apply here apply to every page of the dashboard. Use them to focus on specific carriers, channels, accounts, DC locations, service types, ship-to states or date ranges.
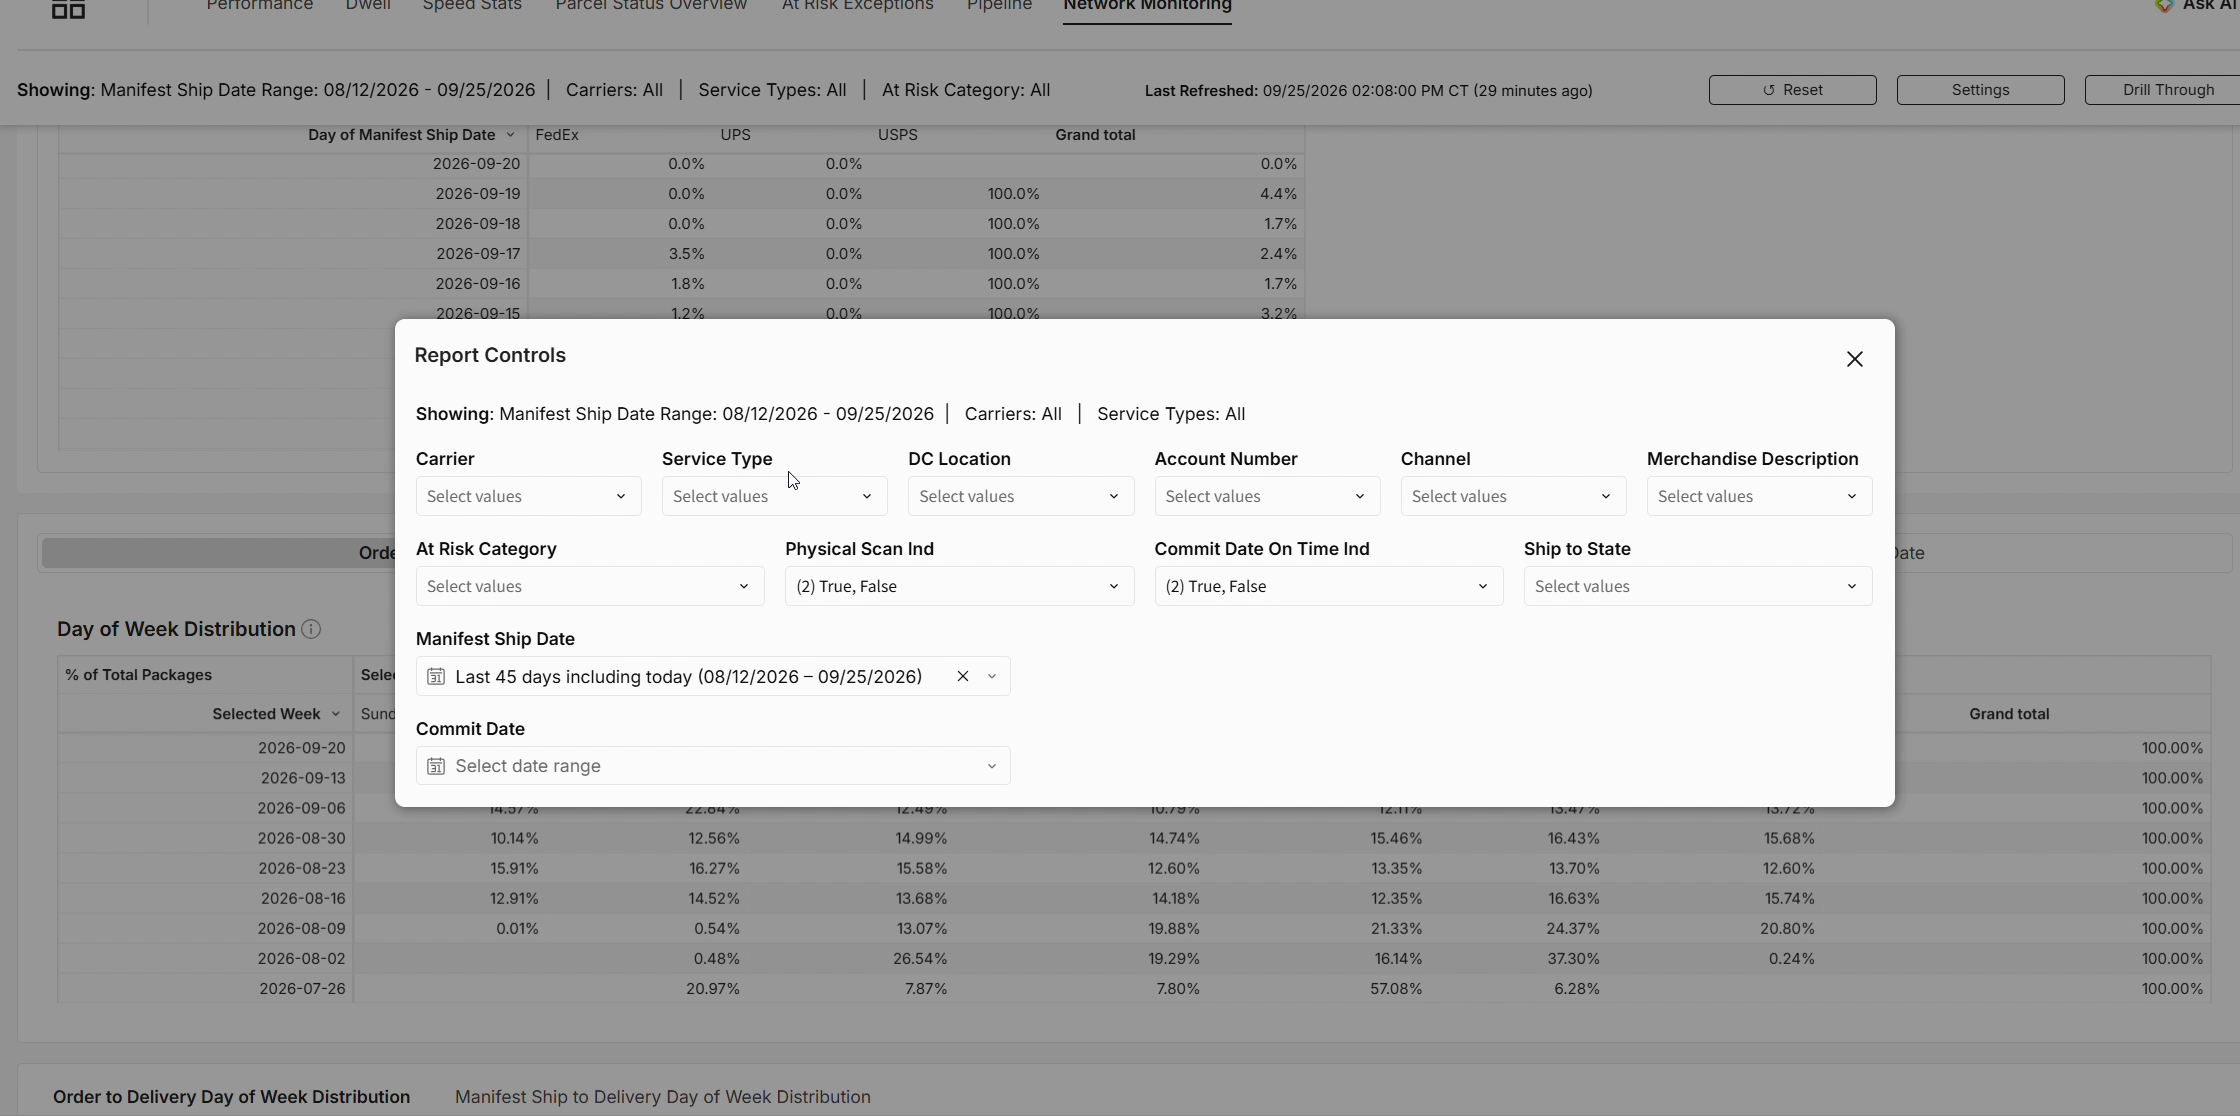
Figure 25. Report Controls, opened from the Settings button.
Tip: the Showing: line in the header always reflects the filters in effect. Click Reset to go back to the default view. |
Quick reference
I want to… | Go to |
Check on-time performance against commit or carrier EDD | Performance |
Find packages that shipped but haven't been physically scanned | Dwell, or Network Monitoring → No Physical Scan Detail |
Measure transit time in calendar or business days | Speed Stats or Pipeline (Calendar / Business toggle) |
See where packages are in the network and which exceptions are occurring | Parcel Status Overview |
Get ahead of packages likely to miss their commit date | At Risk Exceptions |
See trends in volume, scan rate and performance over time | Pipeline |
Understand order, ship and delivery day-of-week patterns | Network Monitoring → Day of Week Distribution |
Get a package-level list to share or analyse | Drill Through → ⋮ → Export |
Filter every page to a carrier, channel or account | Settings → Report Controls |
What It Is
The Real-time Visibility dashboard shows where your packages are in the carrier network and how they're performing against the delivery dates you promised customers. Use it to track on-time performance, find packages that haven't been picked up by the carrier, and act on packages likely to arrive late.
Who should use this: Operations and logistics teams monitoring daily parcel flow, DC and fulfillment teams watching pickup and dwell, and customer experience teams who need to get ahead of late deliveries.
Key Terms
Term | What it means |
|---|---|
Commit date | The delivery date you promised your end customer. Commit performance is the share of packages delivered by that date. |
First EDD | The first Expected Delivery Date the carrier sends for a package. |
Last EDD | The final Expected Delivery Date the carrier sends. Carriers update the EDD over a package's life. |
Physical scan | A carrier scan showing the carrier has actually taken possession of the package. A virtual scan (the carrier saying it expects to receive the package) does not count. |
Dwell | The time between the manifest ship date and the first physical carrier scan. |
Calendar / Business days | Transit metrics can be shown in either, using the toggle at the top of the page. |
Getting Around
The dashboard opens on Performance. Use the tabs along the top to move between pages: Performance, Dwell, Speed Stats, Parcel Status Overview, At Risk Exceptions, Pipeline, and Network Monitoring.
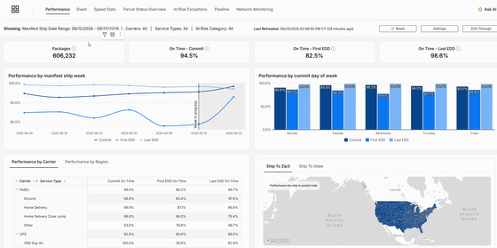
Performance page, where the dashboard opens, with page tabs along the top.
Every page shares the same header bar:
Showing: the filters currently applied (ship date range, carriers, service types, at-risk category)
Last Refreshed: when the data was last updated
Reset: clears your filters and returns to the default view
Settings: opens Report Controls for dashboard-wide filters
Drill Through: opens package-level detail you can filter and export
Tip: To enlarge any chart, hover over it, click the ⋮ menu in the top-right corner, and choose Maximize element.
What's Inside
Performance
On-time performance against three measures: Commit, First EDD, and Last EDD. Headline tiles show the totals for the current data window. Below them, performance is broken out by:
Manifest ship week (trend line)
Commit day of week: for example, the Monday bars show performance for packages with a Monday commit date
Carrier and service type, and region
Geography: a map by 3-digit postal code (hover to see the three metrics), with a Ship To State tab
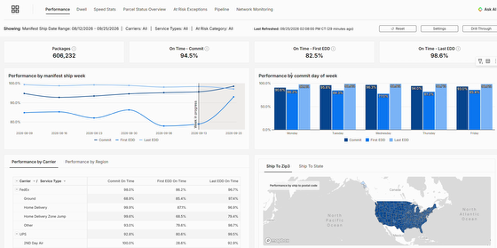
[SCREENSHOT 03: Performance by carrier and 3-digit postal code map]
How to use it: Compare Commit to First EDD and Last EDD. A gap between them tells you whether misses are coming from the carrier's own estimates or from the dates promised to customers.
Dwell
Packages that have a manifest ship date but no physical carrier scan yet. Once a physical scan comes in, the package drops out of dwell. Remember, a virtual scan doesn't end dwell.
Break dwell out by Carrier, DC Location, Service Type, or Channel, and use the map and the Dwell by Site and Carrier table to see where packages are waiting for pickup.
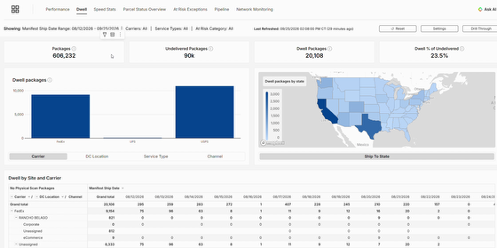
How to use it: If one DC and carrier combination has consistently high dwell, that's a pickup issue to raise with the carrier or the site.
Speed Stats
Transit time from order through delivery:
Order to Ship: days from order to manifest ship
Ship to Delivery: days from ship to delivery
Order to Delivery: the full end-to-end time
The table breaks these out by carrier, with tabs for DC Location and Channel. The Order to delivery days running total chart shows the cumulative share of packages delivered by each day count. Use the Calendar / Business toggle to change how days are counted.
Parcel Status Overview
Puts every package into a status category so you can see where it is: in transit, delivered, delivered to a pickup location, no physical scan, return to shipper, or exception.
The Exception breakout chart shows exception types by manifest ship week, such as weather, unable to locate recipient, unable to access address, and shipper-related delay. Both charts can be viewed by Carrier, DC Location, or Channel.
At Risk Exceptions
Recently shipped packages with commit dates in the current or previous week, sorted into buckets by how likely they are to miss the commit date.
Quick Reference
I want to... | Go to |
|---|---|
Check on-time performance against commit or carrier EDD | Performance |
Find packages that shipped but haven't been physically scanned | Dwell, or Network Monitoring → No Physical Scan Detail |
Measure transit time in calendar or business days | Speed Stats or Pipeline |
See where packages are and which exceptions are occurring | Parcel Status Overview |
Get ahead of packages likely to miss their commit date | At Risk Exceptions |
See volume, scan rate, and performance trends over time | Pipeline |
Understand order, ship, and delivery day-of-week patterns | Network Monitoring → Day of Week Distribution |
Get a package-level list to share or analyze | Drill Through → ⋮ → Export |
Filter every page to a carrier, channel, or account | Settings → Report Controls |
Common Use Cases
Daily at-risk check: Open At Risk Exceptions each morning. Drill into "Carrier EDD after customer commit date" and "Customer commit date today, no scan in the past 8 hours," export the list, and send it to customer service so they can contact customers proactively.
Carrier pickup issues: If Dwell shows packages building up at one DC for one carrier, use the Dwell by Site and Carrier table to size the issue, then pull the package list from Drill Through to share with your carrier rep.
Weekly performance review: Use Performance to compare Commit, First EDD, and Last EDD by carrier and service type, and Pipeline to see whether the trend is improving or slipping.